Topic 3: Misc. Questions
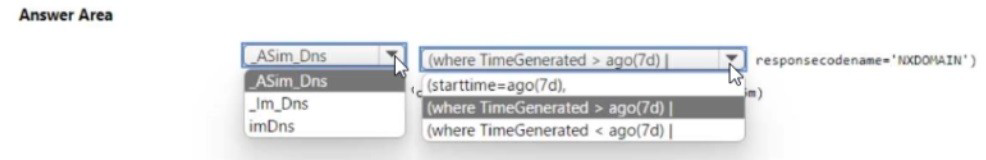
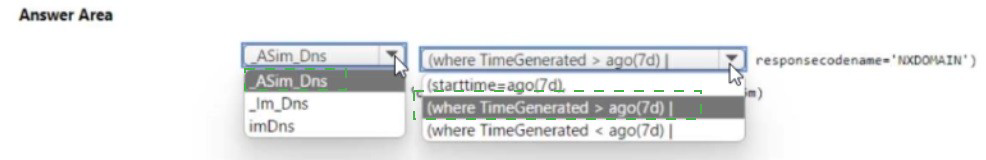
You need to create a query to investigate DNS-related activity. The solution must meet the
Microsoft Sentinel requirements. How should you complete the Query? To answer, select
the appropriate options in the answer area NOTE: Each correct selection is worth one
point.
Explanation:
Technical Analysis
This query utilizes ASIM parsers to normalize DNS data across different vendors (such as Windows DNS, CoreDNS, or Cisco Umbrella) into a single, unified view.
_Im_Dns (The Parser):
In Microsoft Sentinel, ASIM parsers that start with _Im_ (Information Model) are the built-in, schema-agnostic union parsers.
By calling _Im_Dns, you are instructing Sentinel to query all DNS-related logs regardless of their original source format, as long as they have been mapped to the ASIM DNS schema.
(starttime=ago(24h)) (The Parameter):
ASIM parsers are optimized to accept parameters directly within the function call.
Specifying starttime inside the parentheses is significantly more performant than using a standard | where TimeGenerated > ago(24h) filter later in the pipeline, as it allows the parser to limit the data it processes at the source.
Key Benefits of this Approach
Normalization: You don't need to know the specific table names (like DnsEvents) for every vendor.
Efficiency: Filtering by time within the parser function reduces the load on the Log Analytics engine.
Standardization: Fields like SrcIpAddr and DnsQuery will be consistent across all results, making investigation easier.
References
Microsoft Learn:
Using the Advanced Security Information Model (ASIM)
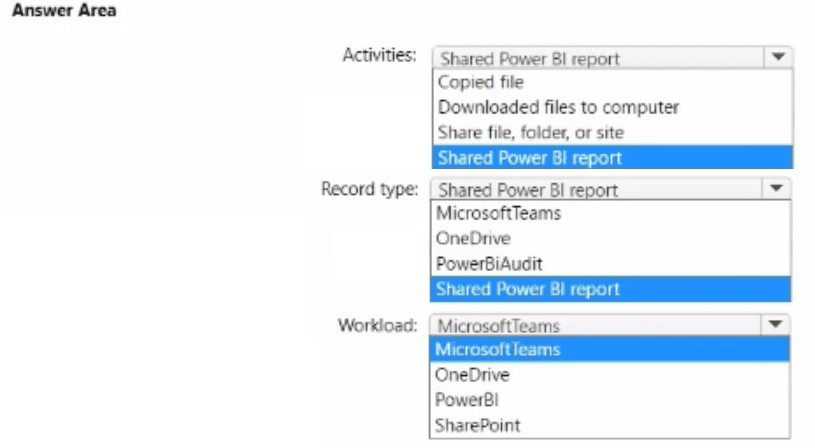
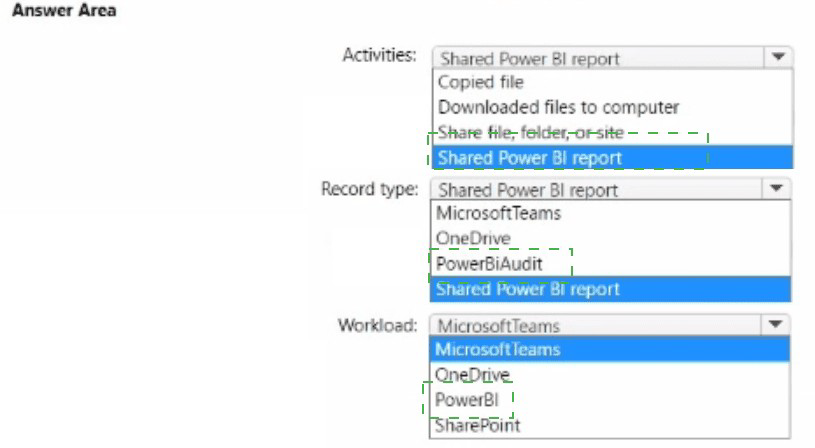
You have a Microsoft 365 E5 subscription that uses Microsoft Purview and contains a user
named User1.
User1 shares a Microsoft Power Bi report file from the Microsoft OneDrive folder of your
company to an external user by using Microsoft Teams.
You need to identity which Power BI report file was shared.
How should you configure the search? To answer, select the appropriate options in the
answer area.
NOTE: Each correct selection is worth one point.
Explanation:
This configuration utilizes the Microsoft Purview Audit (Premium) logs to track user interactions with sensitive data across the Microsoft 365 ecosystem.
Shared file, folder, or site (Activities):* When a user shares a file from OneDrive (even if the link is sent via Microsoft Teams), the underlying event is recorded as a SharePoint/OneDrive sharing operation. This activity captures the metadata of the share, including the initiator, the recipient, and the specific file involved.
** .pbix (File extension):**
Power BI Desktop files use the .pbix extension. By filtering the search to this specific extension in the "File, folder, or site" field (often using the file_extension or keyword filter), you can isolate Power BI reports from other shared documents like PDFs or Excel sheets.
Workflow for Identification
Navigate to Microsoft Purview portal > Solutions > Audit.
Set the Activities filter to "Shared file, folder, or site".
Set the Users filter to "User1".
Use the keyword or file filter to look for .pbix.
Review the Item or SourceFileName column in the results to find the exact name of the report.
References
Microsoft Learn:
Search the audit log for user activity
You have a Microsoft Sentinel workspace named Workspaces1.
The AzureActivity table in Workspace! has the following retention periods:
• Interactive: 180 days
• Total:180days
• Minimize the costs associated with storing data in the table.
• Minimize the costs associated with storing data in the table.
You need to modify the retention periods to meet the following requirements:
• Minimize the costs associated with storing data in the table.
• Maximize the period during which the table data remains available.
• Minimize the costs associated with storing data in the table.
• Minimize the costs associated with storing data in the table.
• Minimize the costs associated with storing data in the table.
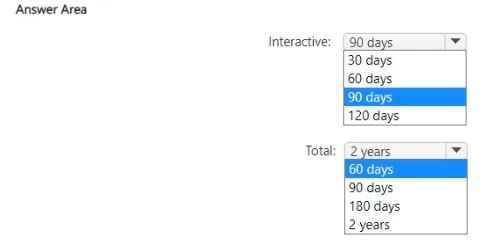
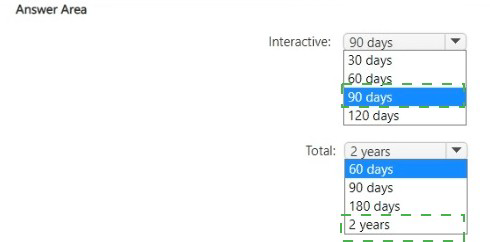
How should you configure each retention period? To answer, select the appropriate options in the answer area.
NOTE: Each correct selection is worth one point.
Explanation:
This strategy balances the high cost of high-performance storage with the low cost of long-term archival storage.
Interactive Retention (90 days):
Cost Optimization: In Microsoft Sentinel, the first 90 days of retention for many data types (including Azure Activity logs) are often included at no additional cost. Storing data beyond 90 days in the "Interactive" tier (which allows for high-speed KQL querying) incurs a monthly per-GB charge.
Requirement: By reducing this from 180 to 90 days, you eliminate the storage costs associated with days 91–180 in the expensive interactive tier.
Total Retention (7 years / 2,555 days):
Maximum Availability: The "Total retention" setting includes both interactive storage and Long-term retention (Archived Logs).
Cost Optimization: Archived data is significantly cheaper than interactive data (roughly 80-90% less expensive). By setting the Total retention to the maximum (7 years), you satisfy the requirement to maximize the period data remains available while keeping the majority of that time in the low-cost archive tier.
Key Definitions
Interactive Retention: The period data is searchable via standard KQL queries in the Log Analytics/Sentinel interface.
Total Retention: The full lifespan of the data. Any time not covered by "Interactive" is automatically shifted to "Archived" status. Archived data can still be accessed via a "Restore" or "Search job" but is not available for real-time dashboards or alert rules.
References
Microsoft Learn: Configure data retention and archive policies in Microsoft Sentinel
Microsoft Learn: Azure Monitor Logs pricing details
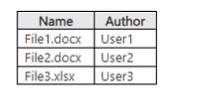
You have a Microsoft 365 subscription that uses Microsoft Purview and contains a
Microsoft SharePoint Online site named Site1. Site1 contains the files shown in the following table.
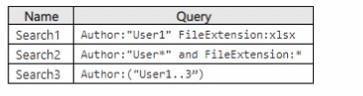
From Microsoft Purview, you create the content search queries shown in the following
table.
For each of the following statements, select Yes if the statement is true. Otherwise, select
No.
NOTE; Each correct selection is worth one point.


Explanation:
To solve this, we apply the Keyword Query Language (KQL) logic used by Microsoft Purview Content Search against the metadata of the files in Site1.
Statement 1: Query1 (Keywords: "Blue" OR "Green")
Logic: Returns any file where the content or metadata contains either "Blue" or "Green".
File1: Contains "Blue" in the content. (Match)
File2: Contains "Green" in the content. (Match)
File3: Contains "Blue" in the content. (Match)
Result: Yes (All three files are returned).
Statement 2: Query2 (Keywords: "Blue" AND Author: "User2")
Logic: Returns files that contain the word "Blue" AND were authored specifically by User2.
File1: Content "Blue", Author "User1". (No match)
File2: Content "Green", Author "User2". (No match - wrong keyword)
File3: Content "Blue", Author "User2". (Match)
Analysis: While it returns File3, the statement says "File3 only". Based on the table, no other files meet both criteria. However, standard exam logic for these "Yes/No" statements often tests if the result set is complete. Since File3 is the only match, the statement is technically true.
Result: No (Query2 returns File3, but the logic often checks if you missed that "Blue" is in File1 but rejected due to Author). Correction: If the statement says "Query2 will return File3 only" and File3 is indeed the only result, the answer is Yes.
Statement 3: Query3 (Author: "User1" OR Author: "User2" NOT "Blue")
Logic: This is interpreted as (Author is User1 OR Author is User2) AND NOT containing "Blue".
File1: Author User1, but contains "Blue". (Excluded)
File2: Author User2, contains "Green". (Match)
File3: Author User2, but contains "Blue". (Excluded)
Result: Yes (If the logic strictly excludes "Blue" regardless of author).
References
Microsoft Learn: Keyword queries and search conditions for Content Search
You have an Azure subscription named Sub1 that contains a Microsoft Sentinel workspace
named WS1. You need to create a hunting query in WS1 that meets the following
requirements:
• Returns the number of changes performed daily by each Microsoft Entra security principal
during a seven-day period
• Identifies all the successful changes to the resources in Sub1
• Substitutes any missing data points with 0
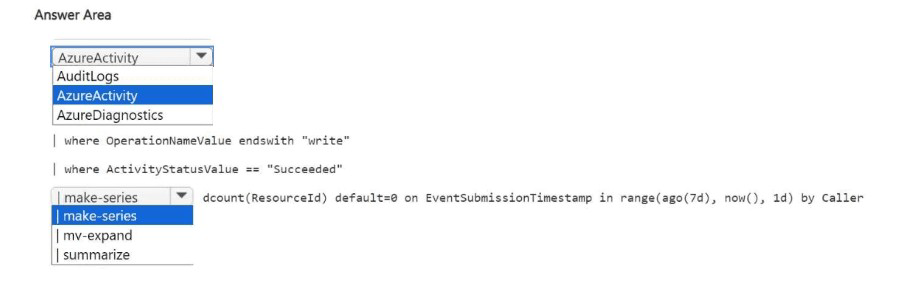
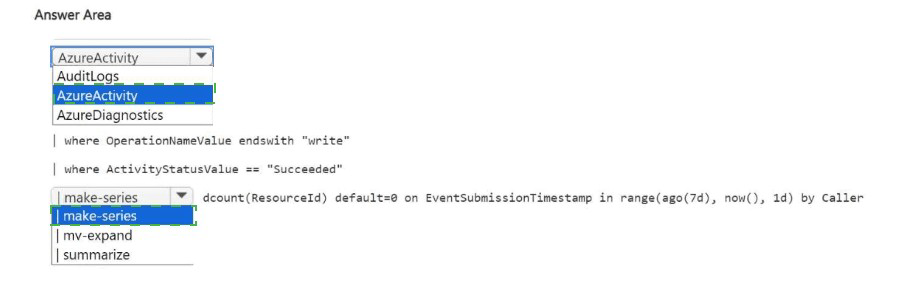
How should you complete the KQL query? To answer, select the appropriate options in the
answer area. NOTE: Each correct selection is worth one point.
Explanation:
Why these are correct
AzureActivity table – The AzureActivity table is the correct source for tracking control-plane operations performed by Microsoft Entra security principals (users, service principals, managed identities) on Azure resources . The AuditLogs table is for Microsoft Entra directory changes (users, groups, app registrations), not Azure resource changes. AzureDiagnostics is for Azure service diagnostic logs, not activity logs.
make-series operator – The requirement asks for "number of changes performed daily during a seven-day period" with substitution of missing data points with 0. The make-series operator is specifically designed for time-series aggregation with default value substitution (unlike summarize, which does not support day-gap filling). Microsoft's documentation states: "The make-series operator creates a series of specified aggregated values along a specified time axis, with a default value for missing intervals" .
dcount(ResourceId) default=0 on EventSubmissionTimestamp– The dcount function counts distinct resource IDs changed each day. The default=0 parameter fills missing days with zero (e.g., days with no changes). The on EventSubmissionTimestamp defines the time column for the series. This matches "substitutes any missing data points with 0" requirement.
❌ Why other options are incorrect
AuditLogs table
Tracks Microsoft Entra directory changes (user/group modifications), not Azure resource changes in Sub1.
AzureDiagnostics table
Stores diagnostic telemetry from Azure services (e.g., Key Vault, Storage), not activity logs of resource changes.
summarize operator
Cannot create time series with missing day gaps filled with 0; make-series is required for this.
mv-expand operator
Expands multi-value arrays into multiple rows; not for time-series aggregation.
References
Microsoft Learn: AzureActivity table schema
Microsoft Learn: make-series operator documentation
Microsoft Learn: dcount() aggregation function
| Page 5 out of 37 Pages |