Free Microsoft PL-900 Practice Test Questions MCQs
Stop wondering if you're ready. Our Microsoft PL-900 practice test is designed to identify your exact knowledge gaps. Validate your skills with Microsoft Power Platform Fundamentals questions that mirror the real exam's format and difficulty. Build a personalized study plan based on your free PL-900 exam questions mcqs performance, focusing your effort where it matters most.
Targeted practice like this helps candidates feel significantly more prepared for Microsoft Power Platform Fundamentals exam day.
2500+ already prepared
Updated On : 17-Jul-202650 Questions
Microsoft Power Platform Fundamentals
4.9/5.0
Topic 1: Understand the business value of Power Platform
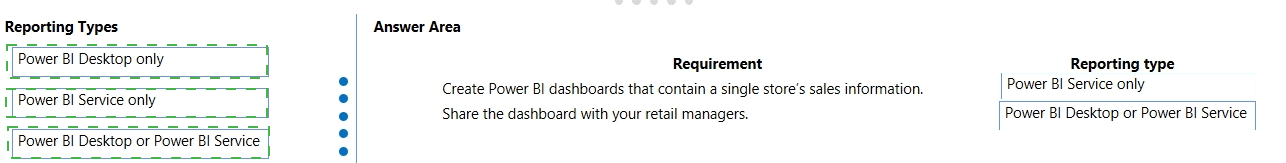
You are a district manager for a large retail company. You want to provide sales managers with deeper sales insights to ensure that they can make more informed decisions for their stores.
Store managers must be able to view data in near real-time.
You need to create and share a Power Bl dashboard that can be used by the store managers.
Which tools can you use? To answer, drag the appropriate reporting types to the correct requirements. Each reporting type may be used once, more than once, or not at all. You may need to drag the split bar between panes or scroll to view content.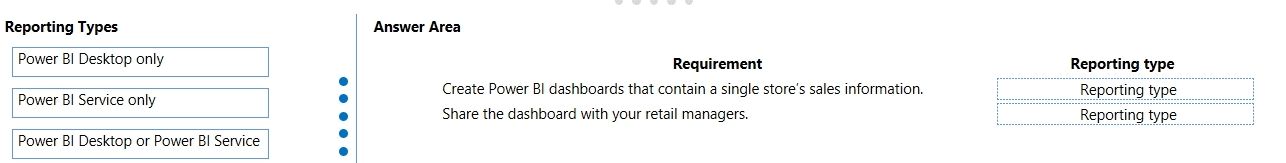
A company plans to create an information portal that managers can use to view critical information about their teams.
You need to recommend the type of Power BI components that the company should use.
What should you recommend? To answer, drag the appropriate components to the correct requirements. Each component may be used once, more than once, or not at all. You may need to drag the split bar between panes or scroll to view content.
NOTE. Each correct selection is worth one point.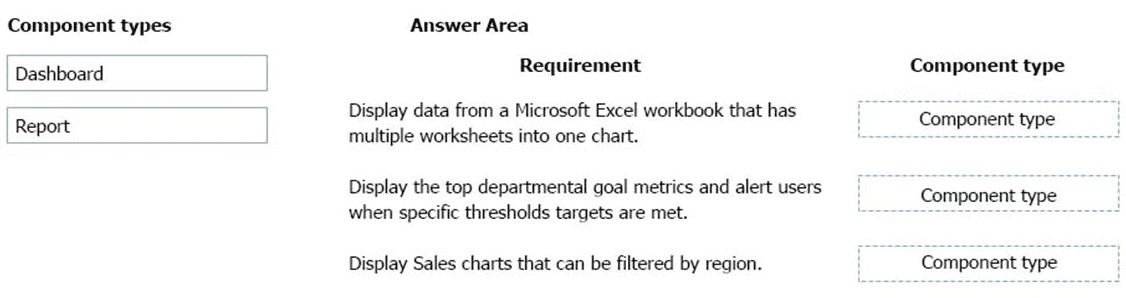
Explanation
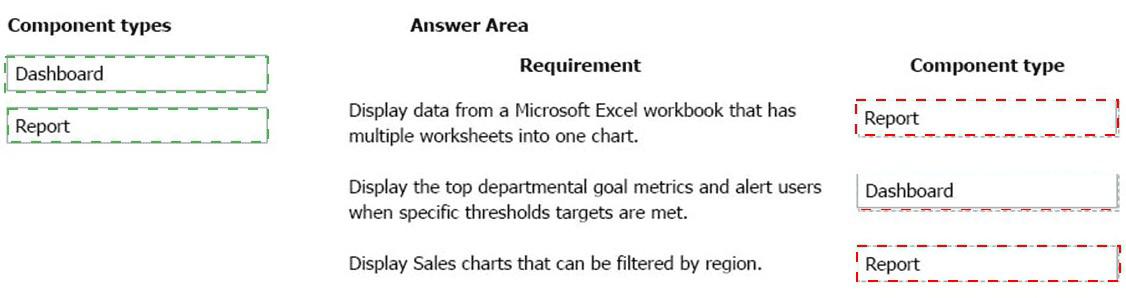
This question tests your understanding of the different containers and features within the Power BI ecosystem. A Report is a multi-page view of data with interactive visuals. A Dashboard is a single-page canvas of pinned visuals and metrics, often including alerts. An App is a packaged collection of dashboards and reports for easy distribution to a large audience. Matching the correct component to the task is key to meeting user needs.
Correct Option
Requirement 1 (Combine Excel worksheets): Report
Explanation: Combining data from multiple worksheets into a single chart requires data modeling and complex visual creation. This is a design and authoring task best suited for a Report. Reports allow you to define relationships between data from different tables (or worksheets) and create visuals that aggregate that combined data into a single chart.
Requirement 2 (Goal metrics with alerts): Dashboard
Explanation: Dashboards are designed for monitoring key performance indicators (KPIs) and providing a high-level overview. The requirement mentions displaying top metrics and alerting users when thresholds are met. This is a classic use case for a Dashboard feature, specifically using dashboard tiles (like KPI visuals) and setting up data alerts on those tiles to notify users via email.
Requirement 3 (Filter charts by region): Report
Explanation: The ability to interactively filter and slice data, such as viewing sales charts filtered by a specific region, is a core functionality of Power BI Reports. While dashboards show static snapshots of pinned visuals, reports allow users to apply filters, slicers, and cross-filter visuals to explore the data from different perspectives, such as by region.
Incorrect Option
Dashboard: While dashboards are excellent for monitoring, they are not the primary tool for combining multiple data sources into a single new chart (Requirement 1). Dashboards display visuals that are created elsewhere (usually in a report) and then pinned. They also do not support the interactive filtering described in Requirement 3; filters on a dashboard only affect the dashboard tiles themselves, not underlying data exploration.
Report: Reports are less suited for Requirement 2. While you can create a KPI visual in a report, the specific feature of "alerting users when specific thresholds are met" is a capability of the Power BI Service applied to dashboard tiles. You cannot set a data alert directly on a report page; you must pin the visual to a dashboard first.
Reference
Microsoft Learn: "Power BI reports" - (Defines reports and their interactive filtering capabilities).
Microsoft Learn: "Power BI dashboards" - (Defines dashboards and features like data alerts).
Microsoft Learn: "Power BI apps" - (Explains how apps bundle content for distribution).
A user is starting to learn about Power Apps.
Which objects should you use? To answer, select the appropriate options in the answer area.
NOTE: Each correct selection is worth one point.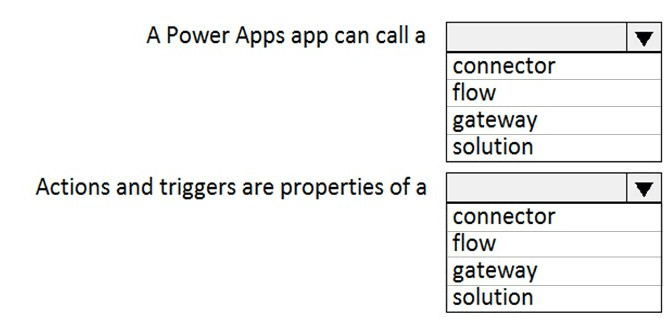
Explanation
This question tests foundational knowledge of the Power Platform architecture, specifically how Power Apps interacts with other components. Understanding that Power Apps can call a connector to access external data sources is essential. Additionally, recognizing that flows (Power Automate) are built with triggers and actions helps differentiate the roles of these components within the platform.
Correct Option
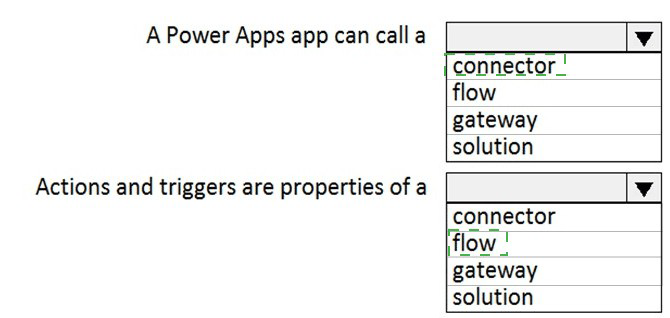
First Blank (A Power Apps app can call a): connector
Explanation: A connector is a wrapper around an API that allows Power Apps to connect to external data sources and services. When a Power Apps app needs to read or write data to systems like SharePoint, SQL Server, or Dynamics 365, it calls a connector. Connectors handle authentication, parameters, and data formatting, providing a standardized way to interact with various services.
Second Blank (Actions and triggers are properties of a): flow
Explanation: In Power Automate (formerly called Flow), every automation is built using a trigger (the event that starts the flow, such as "When an email arrives") and one or more actions (the steps that follow, such as "Send an approval email"). Actions and triggers are fundamental properties that define how a flow operates and responds to events.
Incorrect Option
First Blank Alternatives:
flow: While Power Apps can trigger a flow, the question asks what Power Apps calls to connect to data sources directly. Flows are for automation, not direct data connectivity.
gateway: A gateway enables on-premises data connectivity but is not directly "called" by the app; it works behind the scenes when using specific connectors.
solution: Solutions are containers for packaging and deploying Power Platform components, not something an app directly calls.
Second Blank Alternatives:
connector: Connectors have methods (like GetItems or CreateItem) but these are not called "actions and triggers" in Power Automate terminology.
gateway: Gateways are infrastructure components without triggers or actions.
solution: Solutions are packaging mechanisms that contain flows but do not themselves have triggers or actions.
Reference
Microsoft Learn: "Connectors overview" - (Explains how connectors enable Power Apps to connect to services).
Microsoft Learn: "Triggers and actions in Power Automate" - (Defines the core components of a cloud flow).
| Page 1 out of 5 Pages |
Microsoft Power Platform Fundamentals Practice Exam Questions
These PL-900 practice questions with explanations help beginners understand the core components of the Power Platform. Topics include Power Apps, Power Automate, Power BI, and Dataverse. Each explanation clearly describes the reasoning behind the correct answer, helping learners connect concepts with real-world use cases. This approach enhances understanding and retention of fundamental topics. By practicing regularly, candidates can strengthen their knowledge, identify gaps, and gain confidence in using Power Platform tools and passing the certification exam.PL-900 - Microsoft Power Platform Fundamentals Official Exam Blueprint and Weight:
1. Describe the Business Value of Microsoft Power Platform
Official Exam Weight: 20-25%
Subtopics: Describe the business value of Microsoft Power Platform, identify capabilities of Power Platform, describe how Power Platform supports digital transformation, identify common business scenarios for Power Apps Power Automate Power BI and Power Pages, describe Microsoft Dataverse capabilities, describe connectors and integrations, identify AI Builder capabilities, describe Copilot capabilities in Power Platform, describe low-code and no-code solutions, identify collaboration benefits with Microsoft 365 and Teams, describe business process automation scenarios.
2. Identify Foundational Components of Microsoft Power Platform
Official Exam Weight: 10-15%
Subtopics: Describe Microsoft Dataverse tables columns and relationships, identify environments and environment types, describe solutions and application lifecycle management concepts, identify security roles and permissions, describe connectors and gateways, identify cloud flows desktop flows and business process flows, describe AI Builder models, identify Power Fx capabilities, describe integration with Azure services and Microsoft 365, identify data sources supported by Power Platform.
3. Demonstrate the Capabilities of Power BI
Official Exam Weight: 10-15%
Subtopics: Identify Power BI components and architecture, connect to and transform data, create reports and dashboards, describe data visualization capabilities, identify AI visualizations and analytics capabilities, describe real-time analytics scenarios, share and collaborate with Power BI reports, identify data modeling capabilities, describe Power BI service and Power BI Desktop, identify use cases for Power BI embedded analytics.
4. Demonstrate the Capabilities of Power Apps
Official Exam Weight: 20-25%
Subtopics: Create and manage canvas apps, create and manage model-driven apps, describe Power Apps use cases, connect apps to Microsoft Dataverse and external data sources, use templates and components, implement basic formulas using Power Fx, customize forms and screens, publish and share apps, describe mobile capabilities of Power Apps, identify portal and Power Pages capabilities, describe integration with Power Automate and Power BI.
5. Demonstrate the Capabilities of Power Automate
Official Exam Weight: 10-15%
Subtopics: Create and manage cloud flows, create automated instant and scheduled flows, describe business process flows, identify robotic process automation (RPA) capabilities, use connectors and triggers, configure approvals and notifications, integrate flows with Power Apps and Microsoft Teams, describe process mining capabilities, identify AI Builder integration scenarios, monitor and troubleshoot flows.
6. Demonstrate the Capabilities of Power Pages
Official Exam Weight: 1-5%
Subtopics: Describe Power Pages capabilities, create external-facing business websites, configure authentication and authorization, customize website templates, manage content and forms, connect Power Pages with Microsoft Dataverse, describe portal security concepts, identify use cases for customer self-service portals and partner portals.
| Domain | Title | Exam Weight |
|---|---|---|
| 1 | Describe the Business Value of Microsoft Power Platform | 20-25% |
| 2 | Identify Foundational Components of Microsoft Power Platform | 10-15% |
| 3 | Demonstrate the Capabilities of Power BI | 10-15% |
| 4 | Demonstrate the Capabilities of Power Apps | 20-25% |
| 5 | Demonstrate the Capabilities of Power Automate | 10-15% |
| 6 | Demonstrate the Capabilities of Power Pages | 1-5% |
Customer Love
Learning Power Platform basics became enjoyable with MSmcqs.com practice materials for Microsoft Certified: Power Platform Fundamentals. PL-900 questions clearly explained apps, automation, and analytics tools.
Natalie Green | United States