Free Microsoft DP-100 Practice Test Questions MCQs
Stop wondering if you're ready. Our Microsoft DP-100 practice test is designed to identify your exact knowledge gaps. Validate your skills with Designing and Implementing a Data Science Solution on Azure Exam questions that mirror the real exam's format and difficulty. Build a personalized study plan based on your free DP-100 exam questions mcqs performance, focusing your effort where it matters most.
Targeted practice like this helps candidates feel significantly more prepared for Designing and Implementing a Data Science Solution on Azure Exam exam day.
2500+ already prepared
Updated On : 17-Jul-202650 Questions
Designing and Implementing a Data Science Solution on Azure Exam
4.9/5.0
Topic 1, Case Study 1
Overview
You are a data scientist in a company that provides data science for professional sporting events. Models will
be global and local market data to meet the following business goals:
•Understand sentiment of mobile device users at sporting events based on audio from crowd reactions.
•Access a user's tendency to respond to an advertisement.
•Customize styles of ads served on mobile devices.
•Use video to detect penalty events.
Current environment
Requirements
• Media used for penalty event detection will be provided by consumer devices. Media may include images
and videos captured during the sporting event and snared using social media. The images and videos will have
varying sizes and formats.
• The data available for model building comprises of seven years of sporting event media. The sporting event
media includes: recorded videos, transcripts of radio commentary, and logs from related social media feeds
feeds captured during the sporting events.
•Crowd sentiment will include audio recordings submitted by event attendees in both mono and stereo
Formats.
Advertisements
• Ad response models must be trained at the beginning of each event and applied during the sporting event.
• Market segmentation nxxlels must optimize for similar ad resporr.r history.
• Sampling must guarantee mutual and collective exclusivity local and global segmentation models that share
the same features.
• Local market segmentation models will be applied before determining a user’s propensity to respond to an
advertisement.
• Data scientists must be able to detect model degradation and decay.
• Ad response models must support non linear boundaries features.
• The ad propensity model uses a cut threshold is 0.45 and retrains occur if weighted Kappa deviates from 0.1 +/-5%.
• The ad propensity model uses cost factors shown in the following diagram:

Penalty detection and sentiment
Findings
•Data scientists must build an intelligent solution by using multiple machine learning models for penalty event
detection.
•Data scientists must build notebooks in a local environment using automatic feature engineering and model
building in machine learning pipelines.
•Notebooks must be deployed to retrain by using Spark instances with dynamic worker allocation
•Notebooks must execute with the same code on new Spark instances to recode only the source of the data.
•Global penalty detection models must be trained by using dynamic runtime graph computation during
training.
•Local penalty detection models must be written by using BrainScript.
• Experiments for local crowd sentiment models must combine local penalty detection data.
• Crowd sentiment models must identify known sounds such as cheers and known catch phrases. Individual
crowd sentiment models will detect similar sounds.
• All shared features for local models are continuous variables.
• Shared features must use double precision. Subsequent layers must have aggregate running mean and
standard deviation metrics Available.
segments
During the initial weeks in production, the following was observed:
•Ad response rates declined.
•Drops were not consistent across ad styles.
•The distribution of features across training and production data are not consistent.
Analysis shows that of the 100 numeric features on user location and behavior, the 47 features that come from
location sources are being used as raw features. A suggested experiment to remedy the bias and variance issue
is to engineer 10 linearly uncorrected features.
Penalty detection and sentiment
•Initial data discovery shows a wide range of densities of target states in training data used for crowd
sentiment models.
•All penalty detection models show inference phases using a Stochastic Gradient Descent (SGD) are running
too stow.
•Audio samples show that the length of a catch phrase varies between 25%-47%, depending on region.
•The performance of the global penalty detection models show lower variance but higher bias when comparing
training and validation sets. Before implementing any feature changes, you must confirm the bias and variance
using all training and validation cases.
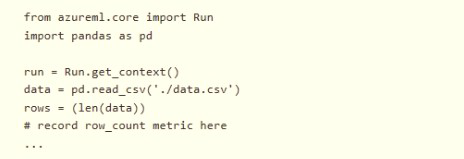
You need to record the row count as a metric named row_count that can be returned using
the get_metrics method of the Run object after the experiment run completes. Which code should you use?
A. run.upload_file(‘row_count’, ‘./data.csv’)
B. run.log(‘row_count’, rows)
C. run.tag(‘row_count’, rows)
D. run.log_table(‘row_count’, rows)
E. run.log_row(‘row_count’, rows)
Explanation
The question requires recording a simple numeric value (the row count) as a metric during an Azure Machine Learning experiment run. The metric must be retrievable after the run using the get_metrics() method. Azure ML provides different logging methods for different data types, and for a single numeric value, the appropriate method is the one that logs a key-value pair to the run's metrics record.
Correct Option
B. run.log('row_count', rows)
The log() function is specifically designed to record a single numeric value as a metric in an Azure ML run.
It creates a key-value pair where 'row_count' is the metric name, and the variable rows (containing the integer value) is the metric value.
After execution, this value can be retrieved using run.get_metrics()['row_count'] and will appear in the Azure ML studio under the run's metrics tab.
Incorrect Option
A. run.upload_file('row_count', './data.csv')
The upload_file() method is used to upload files (like models or datasets) to the run's output storage, not to log metrics.
This would upload the entire CSV file to a location named 'row_count', which is not the intended behavior for tracking a simple row count metric.
Uploaded files are accessible through the "Outputs + logs" section, not through the get_metrics() method.
C. run.tag('row_count', rows)
The tag() method is used to add metadata tags to the run itself for organization and searchability, not for logging experiment metrics.
Tags are typically used for filtering and grouping runs (e.g., 'experiment_type': 'regression'), not for tracking numerical results.
Tags cannot be retrieved using the get_metrics() method.
D. run.log_table('row_count', rows)
The log_table() method is used to log dictionary-like objects or tables where the data has multiple columns and rows.
The rows variable in this context is a single integer (the length of the DataFrame), not a table structure.
Using this for a scalar value would either fail or store it incorrectly as a table with unexpected format.
E. run.log_row('row_count', rows)
The log_row() method is used to log a metric row by row, typically when you want to create a table with multiple columns and append multiple rows over time.
It expects column names and values as key-value pairs (e.g., run.log_row("MyTable", column1=value1, column2=value2)).
Passing a single value rows without a column name specification would result in an error.
Reference
Microsoft Learn: Log metrics in Azure ML experiments
A set of CSV files contains sales records. All the CSV files have the same data schema.
Each CSV file contains the sales record for a particular month and has the filename sales.csv. Each file in stored in a folder that indicates the month and year when the data was recorded. The folders are in an Azure blob container for which a datastore has been defined in an Azure Machine Learning workspace. The folders are organized in a parent folder named sales to create the following hierarchical structure: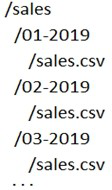
At the end of each month, a new folder with that month’s sales file is added to the sales folder.
You plan to use the sales data to train a machine learning model based on the following requirements:
You must define a dataset that loads all of the sales data to date into a structure that can be easily converted to a dataframe.
You must be able to create experiments that use only data that was created before a specific previous month, ignoring any data that was added after that month.
You must register the minimum number of datasets possible.
You need to register the sales data as a dataset in Azure Machine Learning service workspace.
What should you do?
A. Create a tabular dataset that references the datastore and explicitly specifies each 'sales/mm-yyyy/ sales.csv' file every month. Register the dataset with the name sales_dataset each month, replacing the existing dataset and specifying a tag named month indicating the month and year it was registered. Usethis dataset for all experiments
B. Create a tabular dataset that references the datastore and specifies the path 'sales/*/sales.csv', register the dataset with the name sales_dataset and a tag named month indicating the month and year it was registered, and use this dataset for all experiments.
C. Create a new tabular dataset that references the datastore and explicitly specifies each 'sales/mm-yyyy/ sales.csv' file every month. Register the dataset with the name sales_dataset_MM-YYYY each month with appropriate MM and YYYY values for the month and year. Use the appropriate month-specific dataset for experiments.
D. Create a tabular dataset that references the datastore and explicitly specifies each 'sales/mm-yyyy/ sales.csv' file. Register the dataset with the name sales_dataset each month as a new version and with a tag named month indicating the month and year it was registered. Use this dataset for all experiments, identifying the version to be used based on the month tag as necessary.
Explanation
The scenario requires loading all sales data to date while maintaining the ability to filter data by time. The folder structure uses wildcard-compatible patterns with month/year folders. The key requirements are loading all data easily, filtering by specific months, and registering the minimum number of datasets. Understanding Azure ML dataset path patterns and versioning strategies is essential to meet these requirements.
Correct Option
B. Create a tabular dataset that references the datastore and specifies the path 'sales/*/sales.csv', register the dataset with the name sales_dataset and a tag named month indicating the month and year it was registered, and use this dataset for all experiments.
The path pattern 'sales//sales.csv' uses a wildcard () to include all month-year subfolders, automatically incorporating new monthly data as it is added.
This satisfies loading all sales data to date with a single dataset registration, meeting the minimum dataset requirement.
Since the dataset loads all available data, filtering for experiments that require data before a specific month can be done in code after loading the dataframe, using the month tags from folder names or date columns in the data.
Registering with a month tag provides metadata about when the dataset was last updated, though it is not strictly necessary for the filtering requirement.
Incorrect Option
A. Create a tabular dataset that references the datastore and explicitly specifies each 'sales/mm-yyyy/sales.csv' file every month. Register the dataset with the name sales_dataset each month, replacing the existing dataset and specifying a tag named month indicating the month and year it was registered. Use this dataset for all experiments.
This approach requires manually updating the dataset definition every month to include the new file path.
Replacing the existing dataset each month loses the ability to reference previous dataset states, making it impossible to reproduce experiments that used earlier data without manual intervention.
This violates the requirement to use data from before a specific previous month, as the overwritten dataset only contains the latest configuration.
C. Create a new tabular dataset that references the datastore and explicitly specifies each 'sales/mm-yyyy/sales.csv' file every month. Register the dataset with the name sales_dataset_MM-YYYY each month with appropriate MM and YYYY values for the month and year. Use the appropriate month-specific dataset for experiments.
This creates a new dataset each month with a month-specific name, resulting in many registered datasets over time.
While this allows precise filtering by selecting the appropriate month-specific dataset, it violates the requirement to register the minimum number of datasets possible.
It also requires manual creation and management of multiple datasets instead of leveraging path patterns.
D. Create a tabular dataset that references the datastore and explicitly specifies each 'sales/mm-yyyy/sales.csv' file. Register the dataset with the name sales_dataset each month as a new version and with a tag named month indicating the month and year it was registered. Use this dataset for all experiments, identifying the version to be used based on the month tag as necessary.
This approach requires updating the dataset definition each month to add the new file path and creating a new version.
While versioning preserves history, it still requires manual updates and creates multiple versions, though they share the same name.
The requirement to filter by specific months would require selecting the correct version based on tags, but each version contains all files up to that point, not just a specific month, making month-specific filtering impossible without post-load filtering.
Reference
Microsoft Learn: Create Azure Machine Learning datasets
Note: This question is part of a series of questions that present the same scenario.
Each question in the series contains a unique solution that might meet the stated goals. Some question sets might have more than one correct solution, while others might not have a correct solution.
After you answer a question in this section, you will NOT be able to return to it. As a result, these questions will not appear in the review screen.
You create a model to forecast weather conditions based on historical data.
You need to create a pipeline that runs a processing script to load data from a datastore and pass the processed data to a machine learning model training script.
Solution: Run the following code: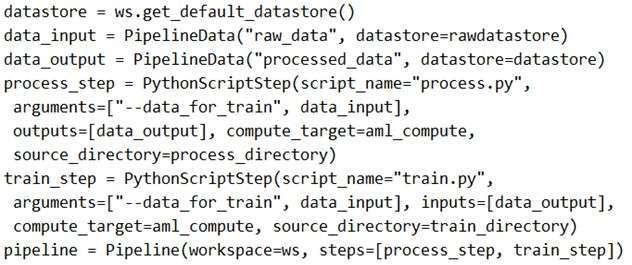
Does the solution meet the goal?
A. Yes
B. No
Explanation
The goal requires creating a pipeline where a processing script loads data from a datastore and passes the processed data to a training script. The provided code attempts to define a two-step pipeline with process_step and train_step. The key requirement is correct data flow between steps, where the processed data from the first step becomes the input to the second step.
Correct Option
B. No
The solution fails because the data flow between steps is incorrectly configured. In the code, process_step takes data_input as an argument and produces data_output.
However, train_step incorrectly uses data_input as its data source instead of using the data_output from process_step. This means the training script receives unprocessed raw data directly from the datastore, not the processed data.
The inputs=[data_output] parameter in train_step specifies that data_output is an input, but the script arguments still reference data_input.
For the pipeline to work correctly, the train_step arguments should reference data_output instead of data_input, ensuring the processed data flows properly between steps.
Reference
Microsoft Learn: Build Azure Machine Learning pipelines
| Page 1 out of 5 Pages |
Designing and Implementing a Data Science Solution on Azure Exam Practice Exam Questions
These DP-100 practice questions with explanations help candidates learn how to build and deploy data science solutions using Azure. Topics include machine learning models, data preparation, training, and deployment. Each explanation helps learners understand the reasoning behind each answer, making complex concepts easier to grasp. This approach supports both theoretical learning and practical application. By practicing these questions, candidates can improve their data science skills, strengthen their understanding of Azure ML services, and confidently prepare for the certification exam.DP-100 - Designing and Implementing a Data Science Solution on Azure Official Exam Blueprint and Weight:
1. Design and Prepare a Machine Learning Solution
Official Exam Weight: 20-25%
Subtopics: Identify machine learning workloads and business objectives, select Azure Machine Learning workspace resources, configure compute targets and environments, configure data storage and access, choose appropriate machine learning models and frameworks, configure security and access controls, manage datasets and data assets, implement responsible AI principles, identify model evaluation metrics, design data ingestion strategies, configure experiment tracking and versioning, select development tools including notebooks and SDKs, design reproducible machine learning workflows.
2. Explore Data and Train Models
Official Exam Weight: 35-40%
Subtopics: Prepare and clean data for machine learning, perform exploratory data analysis, engineer and select features, split datasets for training and validation, train regression classification and clustering models, use automated machine learning (AutoML), tune hyperparameters, evaluate model performance, interpret model metrics, use Python SDK and notebooks for model training, create and manage experiments, use MLflow for experiment tracking, identify overfitting and underfitting issues, optimize model accuracy and performance.
3. Prepare a Model for Deployment
Official Exam Weight: 20-25%
Subtopics: Register and manage machine learning models, create inference pipelines, configure deployment environments, package models for deployment, configure real-time and batch endpoints, implement model versioning, create scoring scripts and environment configurations, validate deployed models, implement authentication and authorization for endpoints, optimize deployment configurations, test model endpoints, configure deployment scaling and monitoring, troubleshoot deployment issues.
4. Deploy and Retrain Models
Official Exam Weight: 10-15%
Subtopics: Deploy models to Azure Container Instances (ACI) and Azure Kubernetes Service (AKS), configure online and batch inferencing, monitor model performance and drift, implement continuous integration and continuous deployment (CI/CD) pipelines for machine learning, automate retraining workflows, schedule retraining pipelines, configure endpoint monitoring and alerts, manage model lifecycle operations, optimize inference performance and costs, update and redeploy models.
5. Manage and Monitor Machine Learning Solutions
Official Exam Weight: 10-15%
Subtopics: Monitor compute and storage resources, configure logging and diagnostics, track experiments and model metrics, manage machine learning assets and environments, implement governance and compliance practices, configure role-based access control, monitor model usage and endpoint health, manage quotas and resource utilization, troubleshoot operational issues, maintain machine learning pipelines and workflows, implement auditing and monitoring solutions.
| Domain | Title | Exam Weight |
|---|---|---|
| 1 | Design and Prepare a Machine Learning Solution | 20-25% |
| 2 | Explore Data and Train Models | 35-40% |
| 3 | Prepare a Model for Deployment | 20-25% |
| 4 | Deploy and Retrain Models | 10-15% |
| 5 | Manage and Monitor Machine Learning Solutions | 10-15% |
What Our Clients Say
Data science on Azure requires mastery of Python, machine learning pipelines, and MLOps. The DP-100 exam challenged me on all fronts. MSmcqs provided practice test that covered experiment tracking, model deployment, and automated ML perfectly. The questions were so accurate that the real exam felt like another practice session. Passed with confidence!
Rachel Chen, Data Scientist | Boston, MA