Topic 4, Misc. Questions
You are creating a line chart in a Power Bl report as shown in the following exhibit. Use the drop-down menus to select the answer choice that completes each statement based on the information presented in the graphic.


You need to create a visual that enables the adhoc exploration of data as shown in the following exhibit.
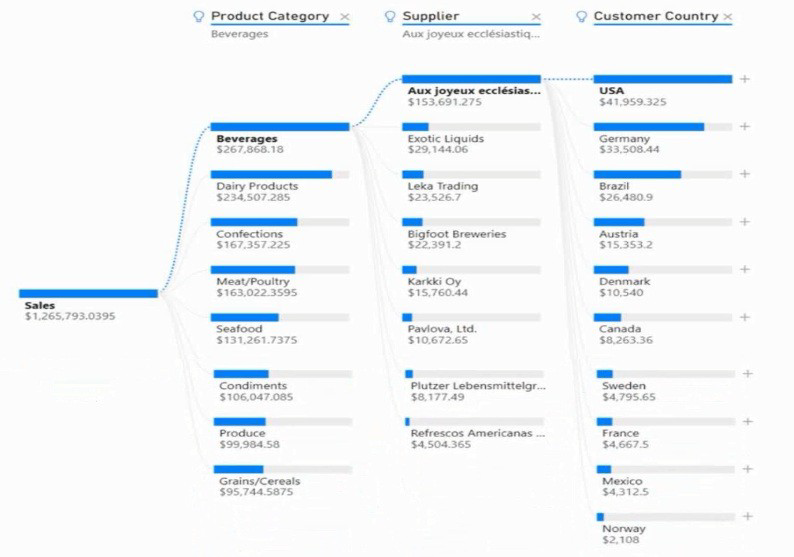
Which type of visual should you use?
A.
Q&A
B.
decomposition tree
C.
smart narrative
D.
key influencers
decomposition tree
You use Power 81 Desktop to load data from a Microsoft SQL Server database.
While waiting for the data to load, you receive the following error.

You need to resolve the error.
What are two ways to achieve the goal? Each correct answer presents a complete solution.
NOTE: Each correct selection is worth one point.
A.
Split long running queries into subsets Of columns and use power Query to the queries
B.
Disable query folding on long running queries
C.
Reduce number of rows and columns returned by each query.
D.
Use Power Query to combine long running queries into one query.
Disable query folding on long running queries
D.
Use Power Query to combine long running queries into one query.
You have a folder that contains 100 CSV files.
You need to make the file metadata available as a single dataset by using Power Bi The solution must NOT store the data of the CSV files.
Which three actions should you perform in sequence. To answer, mow the appropriate actions from the list of actions to the answer area and arrange them m the correct order.
NOTE; More than one order of answer choices is correct. You will receive credit for any of the correct orders you select.


A.
Option A
B.
Option B
C.
Option C
D.
Option D
Option B

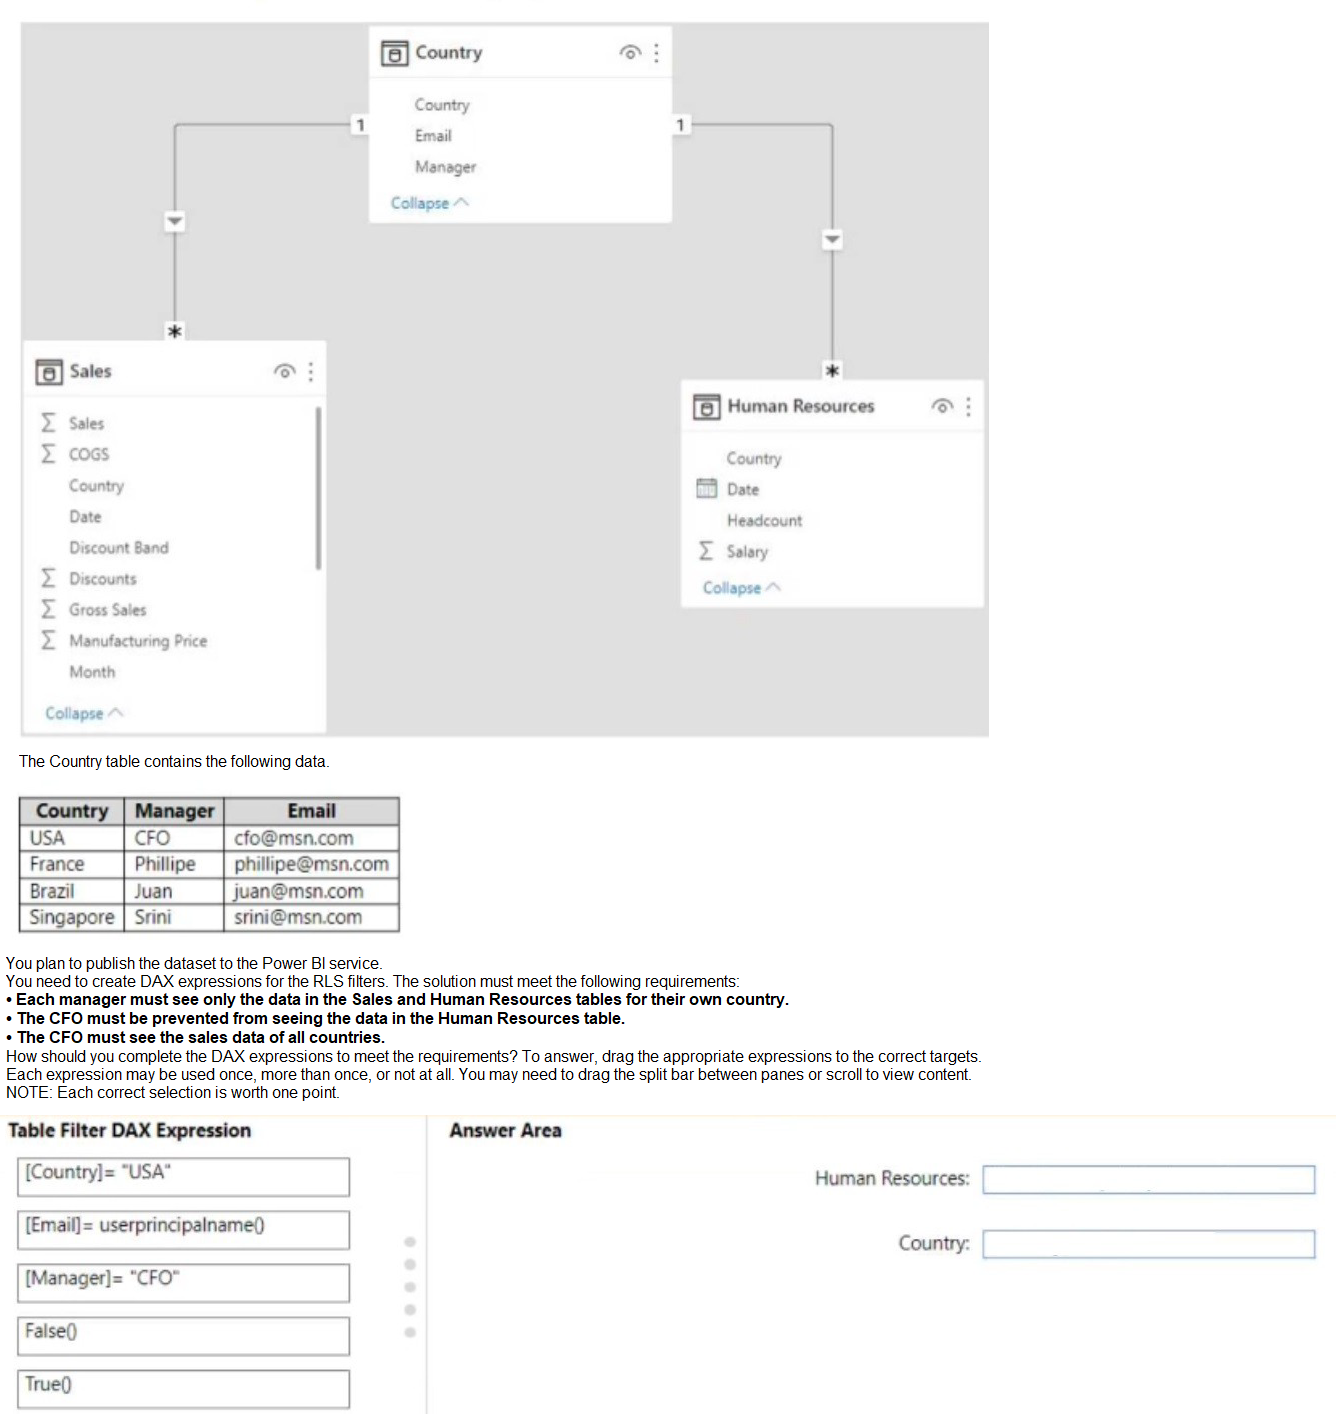
You have the Power Bl data model shown in the following exhibit.
You create two row-level security (RlS) roles named Manager and CFO.
You plan to publish the dataset to the Power Bl service.
You need to create DAX expressions for the RLS filters. The solution must meet the following requirements:
• Each manager must see only the data in the Sales and Human Resources tables for their own country.
• The CFO must be prevented from seeing the data in the Human Resources table.
• The CFO must see the sales data of all countries.
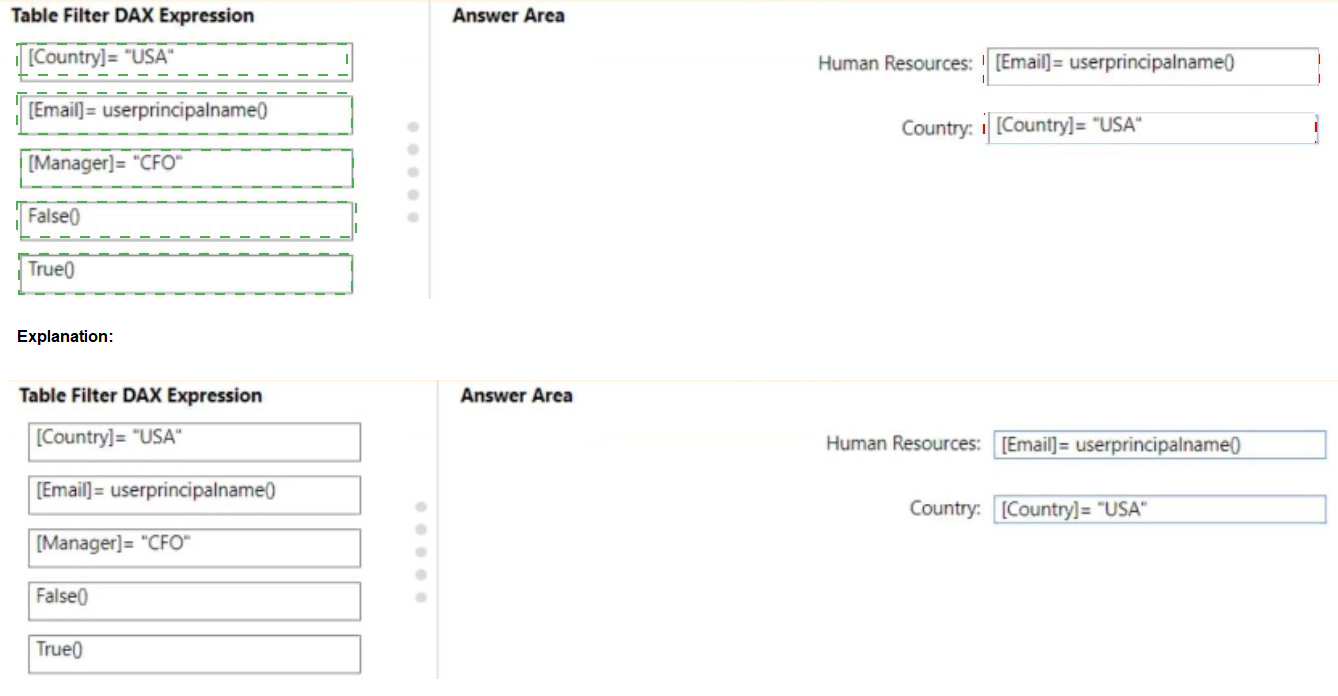
How should you complete the DAX expressions to meet the requirements? To answer, drag the appropriate expressions to the correct targets. Each expression may be used
once, more than once, or not at all. You may need to drag the split bar between panes or scroll to view content.
NOTE: Each correct selection is worth one point.
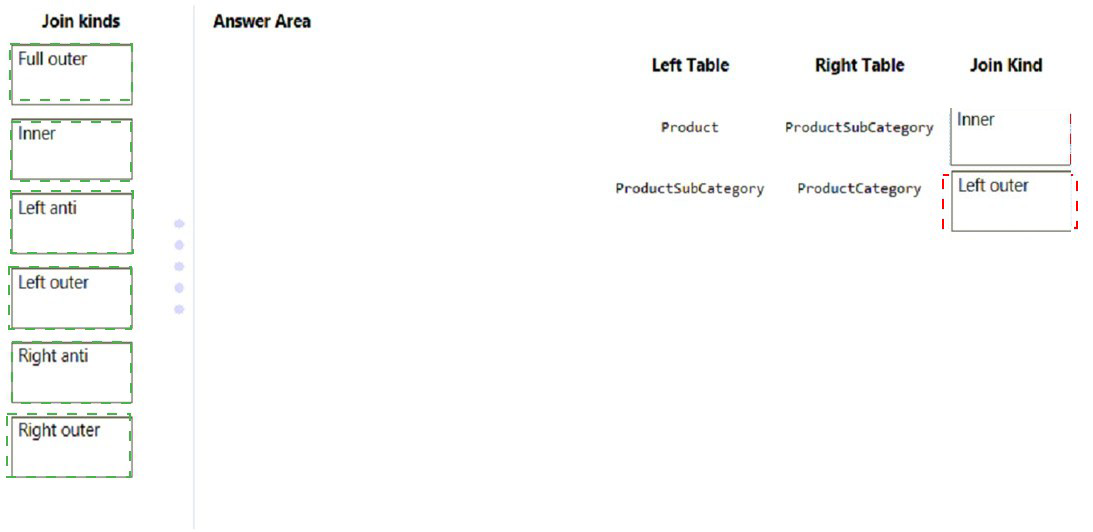
In Power Query Editor, you have three queries named ProductCategory, ProductSubCategory, and Product.
Every Product has a ProductSubCategory.
Not every ProductsubCategory has a parent ProductCategory.
You need to merge the three queries into a single query. The solution must ensure the best performance in Power Query.
How should you merge the tables? To answer, drag the appropriate merge types to the correct queries. Each merge type may be used once, more than once, or not at all. You may need to drag the split bar between panes or scroll to view content.
NOTE: Each correct selection is worth one point.

| Page 9 out of 29 Pages |