Topic 4, Misc. Questions
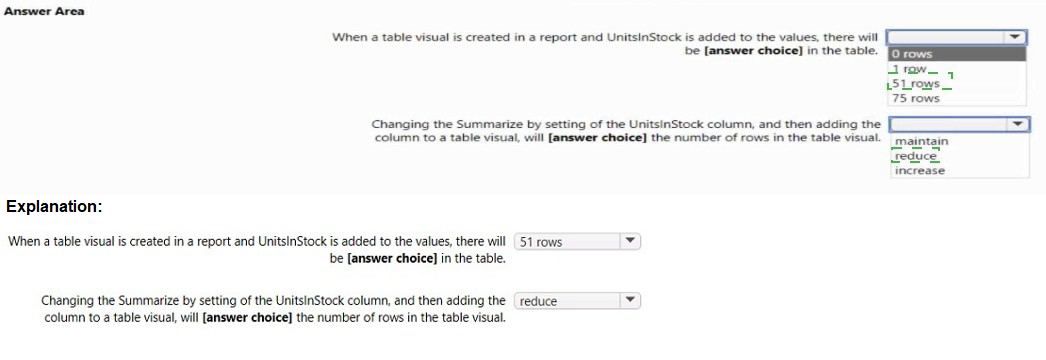
You have a column named UnitslnStock as shown in the following exhibit:

You have a Power Bl query named Sates that imports the columns shown in the following table.

Usees only use the dale part of the Sales.Date field. Only rows with a Status of Finished are used in analysis.
You need to reduce the load times of the query without affecting the analysis.
Which two actions achieve this goal? Each correct answer presents a complete solution.
NOTL Each correct selection is worth one pant.
A.
Remove the rows in which sales [status] has a value of Canceled.
B.
Change the data type of sale [Delivery_Time] to Integer
C.
Removes (Canceled Date).
D.
Split Sales [Sale_Date] into separate date and time columns.
E.
Remove sales [Sales_Date].
Remove the rows in which sales [status] has a value of Canceled.
D.
Split Sales [Sale_Date] into separate date and time columns.
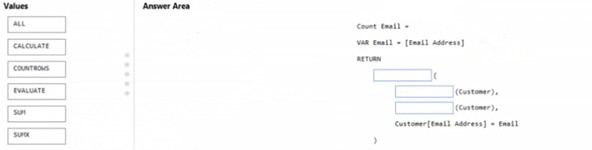
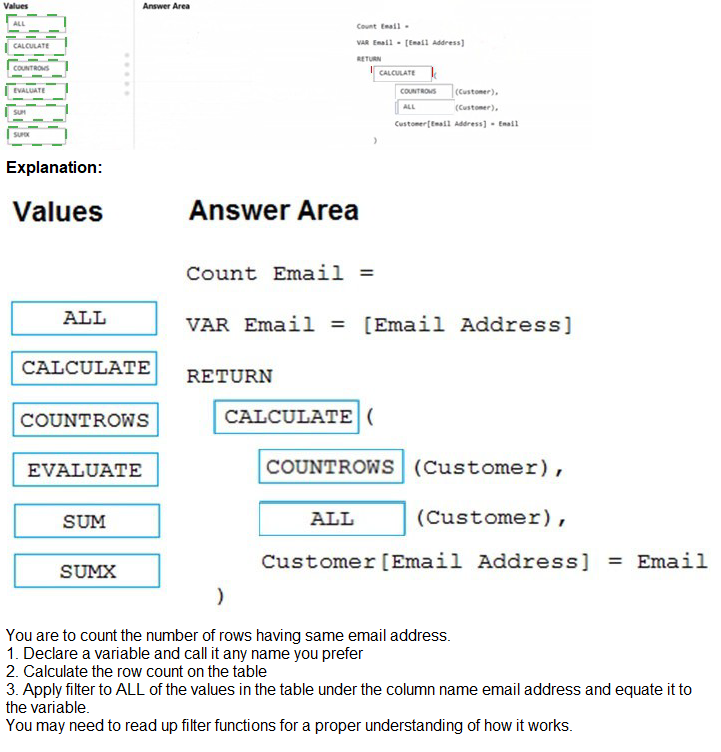
You have a Power Bl table named Customer that contains a field named Email Address.
You discover that multiple records contain the same email address.
You need to create a calculated column to identify which records have duplicate email addresses.
How should you complete the OAX expression for the calculated column? To answer, drag the appropriate values to the correct targets. Each value may be used once, more than once, or not at all. You may need to drag the split bar between panes or scroll to view content.
NOTE: Each correct selection is worth one point.
You are using the key influencers visual to identify which factors affect the quantity of items sold in an order.
You add the following fields to the Explain By field:
* Customer Country
* Product Category
* Supplier Country
* Sales Employee
* Supplier Name
* Product Name
* Customer City
The key influencers visual returns the results shown in the following exhibit.

What can you identify from the visual?
A.
Customers in Austria order 18.8 more units than the average order quantity.
B.
Customers in Boise order 20.37 percent more than the average order quantity
C.
Product Category positively influences the quantity per order.
D.
Customers in Cork order lower quantities than average.
Customers in Austria order 18.8 more units than the average order quantity.
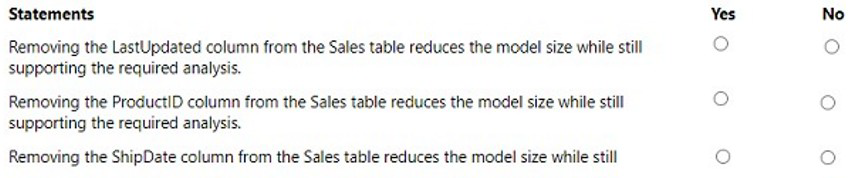
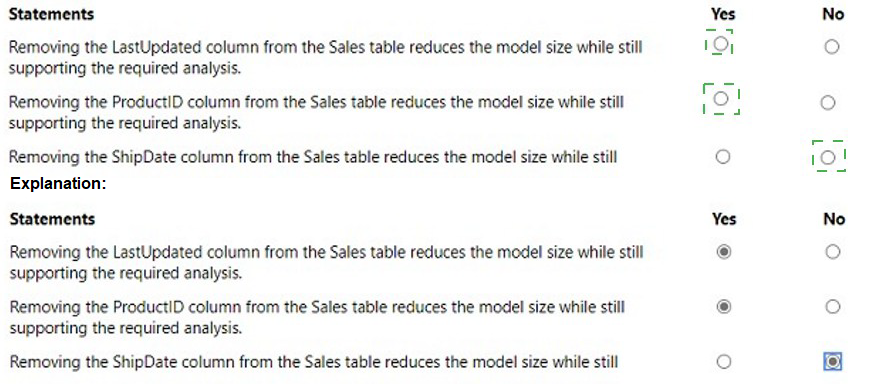
You have a Power BI imported dataset that contains the data model shown in the following exhibit.
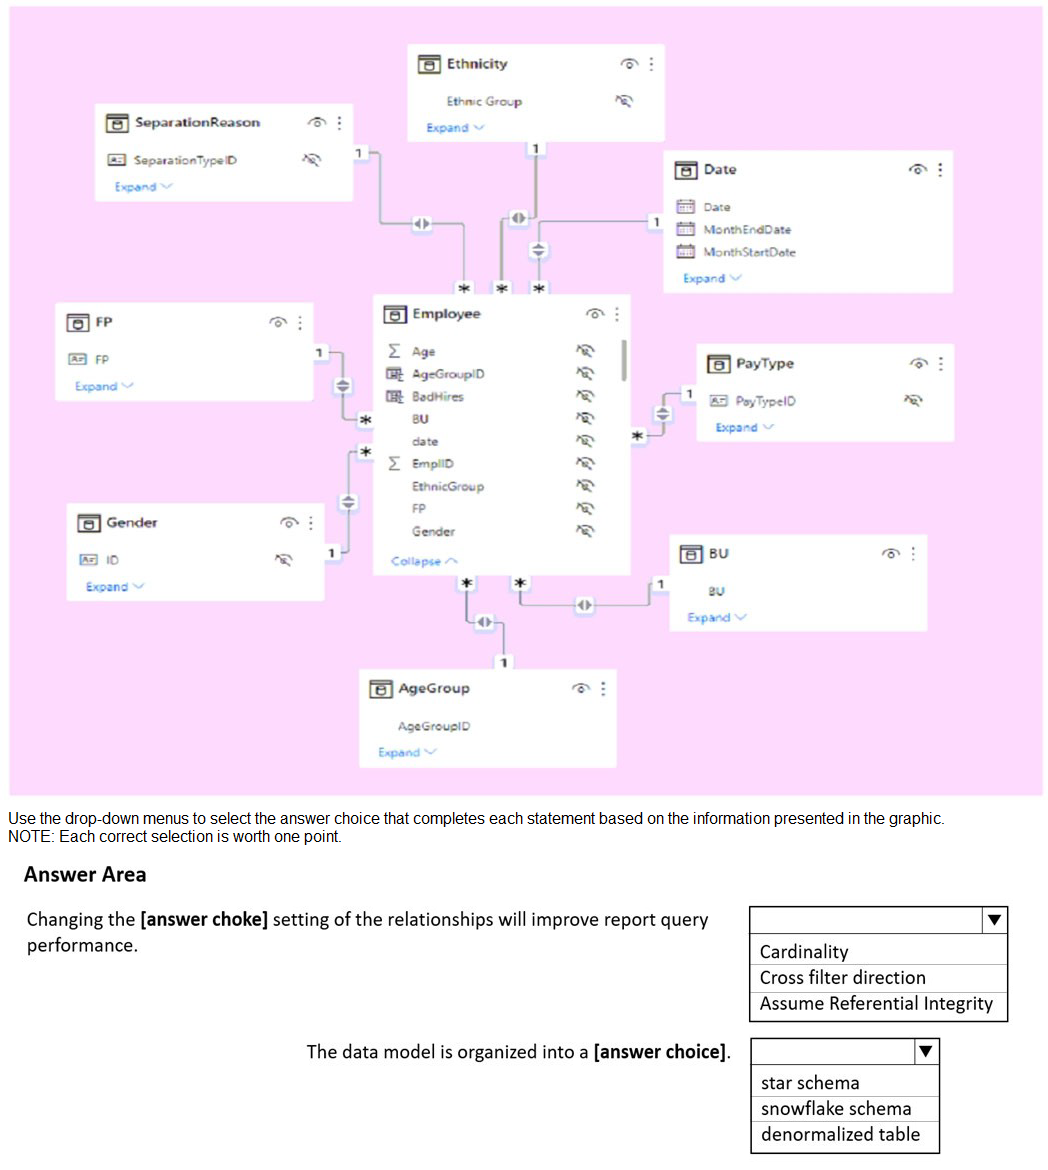
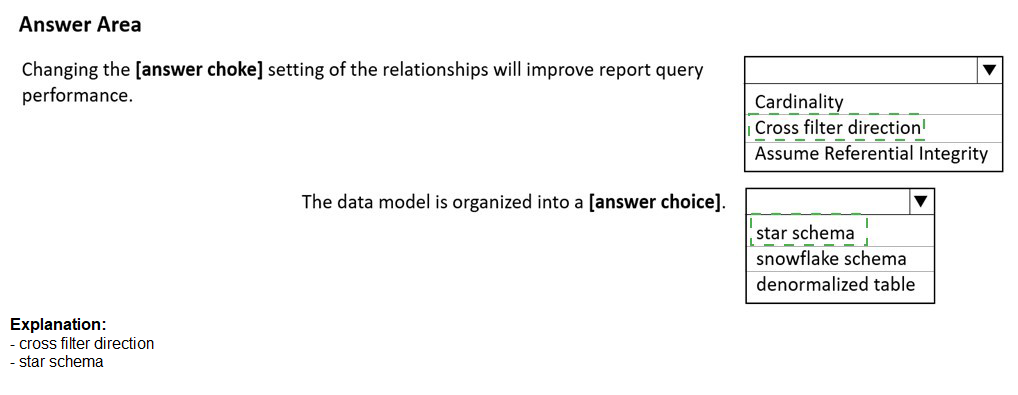
The data model must support the following analysis:
Total sales by product by month in which the order was placed.
Quantities sold by product by day on which the order was placed.
Number Of sales transactions by quarter in Which the order was placed.
For each Of the following statements, select Yes if the statement is true. Otherwise, select NO.
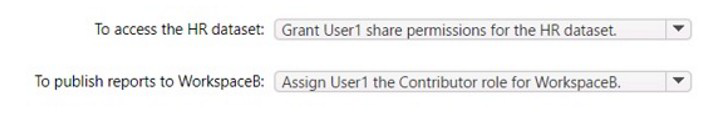
You have two Power Bl workspaces named WorkspaceA and Workspaces. WorkspaceA contains two datasets named Sales and HR.
You need to provide a user named User1 with access to the workspaces. The solution must meet the following requirements:
• Create reports that use the HR dataset.
• Publish the reports to WorkspaceB.
• Prevent the ability to modify the HR dataset.
• Prevent the ability to add users to WorkspaceB.
| Page 6 out of 29 Pages |