Topic 4, Misc. Questions
You have a Power Bl report.
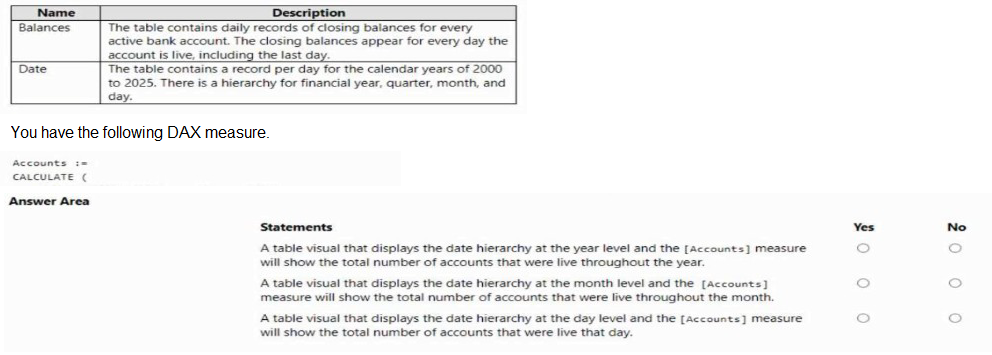
You have the following tables.


You are creating a Power BI report to analyze consumer purchasing patterns from a table named Transactions. The Transactions table contains a numeric field named Spend. You need to include a visual that identifies which fields have the greatest impact on Spend. Which type of visual should you use?
A.
decomposition tree
B.
Q&A
C.
smart narrative
D.
key influences
key influences
You are creating a dashboard by using the Power Bl service.
You have an existing report page that contains three charts.
You need to add the charts to the dashboard while maintaining the interactivity between the charts.
What should you do?
A.
Pin each chart as a tile.
B.
Edit interactions in the report and set all interactions to Filter
C.
Edit the dashboard theme and pin each chart as a file.
D.
Pin the report page as a live tile.
You have a Power Bl report named Report1 and a dashboard named Dashboard1, Report1 contains a line chart named Sales by month.
You pin the Sales by month visual to Dashboard1.
In Report1, you change the Sales by month visual to a bar chart.
You need to ensure that bar chart displays on Dashboard1.
What should you do?
A.
Edit the details for the dashboard tile of Dashboard1.
B.
Select Refresh visuals for Dashboard1.
C.
the Sales by month bar chart to Dashboard1
D.
Refresh the dataset used by Report1 and Dashboard1.
the Sales by month bar chart to Dashboard1
You have a Power 31 data model that contains a table named Stores. The table has the following columns:
* Store Name
* Open Date
* Status
* State
* City
You need to create a calculated column named Active Store Name that meets the following requirements:

You have a Rawer Bl report That imports a dace table and a sales table from an Azure SQL database data source. The sales table has the following date foreign keys:
• Due Date
• Order Date
• Delivery Date
You need to support the analysis of sales over time based on all three dates at the same time.
Solution: From the Fields pane, you rename the date table as Due Date. You use a DAX expression to create Order Date and Delivery Date as calculated tables. You create active relationships between the sales table and each date table.
Does this meet the goal?
A.
Yes
B.
No
Yes
You have a dataset that is used infrequently and refreshes every hour.
You receive a notification that the refresh was disabled due to inactivity.
Which two actions will cause the scheduled refresh schedule to resume? Each correct answer presents a complete solution.
NOTE: Each correct selection is worth one point.
A.
Enable query caching for the dataset.
B.
Import the dataset to Microsoft Excel.
C.
From the Power BI service, open a dashboard that uses the dataset.
D.
From the Power BI service, open a report that uses the dataset.
E.
From PowerShell, run the get-powerbireport cmdlet.
From the Power BI service, open a dashboard that uses the dataset.
D.
From the Power BI service, open a report that uses the dataset.
After two months of inactivity, scheduled refresh on your dataset is paused. A dataset is considered inactive when no user has visited any dashboard or report built on the dataset. At that time, the dataset owner is sent an email indicating the scheduled refresh is paused. The refresh schedule for the dataset is then displayed as disabled. To resume scheduled refresh, simply revisit any dashboard or report built on the dataset.
https://learn.microsoft.com/en-us/power-bi/connect-data/refresh-scheduledrefresh#scheduled-refresh
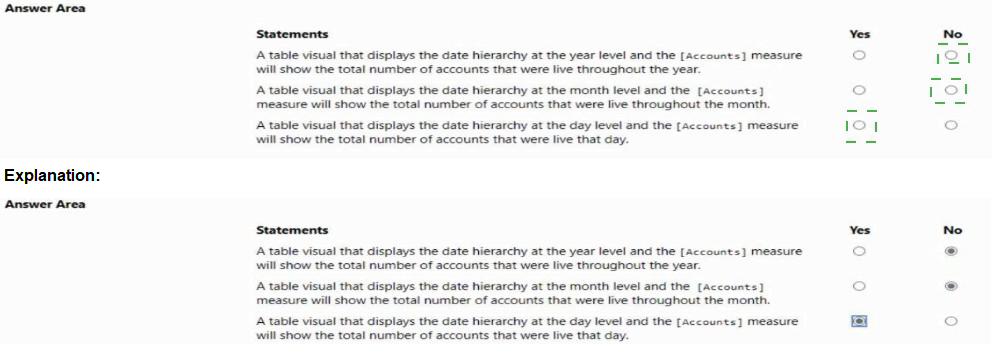
Note: This question is part of a series of questions that present the same scenario. Each question in the series contains a unique solution that might meet the stated goals. Some question sets might have more than one correct solution, while others might not have a correct solution. After you answer a question in this section, you will NOT be able to return to it. As a result, these questions will not appear in the review screen.
From Power Query Editor, you profile the data shown in the following exhibit.

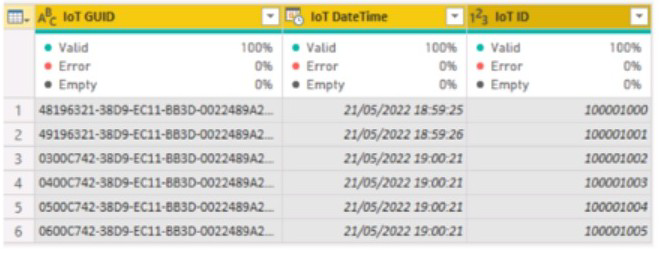
The IoT GUID and IoT ID columns are unique to each row in query.
You need to analyze IoT events by the hour and day of the year. The solution must improve dataset performance.
Solution: You remove the loT GUID column and retain the loT ID column.
Does this meet the goal?
A.
Yes
B.
No
Yes
You plan to create a Power Bl dataset to analyze attendance at a school. Data will come from two separate views named View1 and View? in an Azure SQL database. View1 contains the columns shown in the following table.


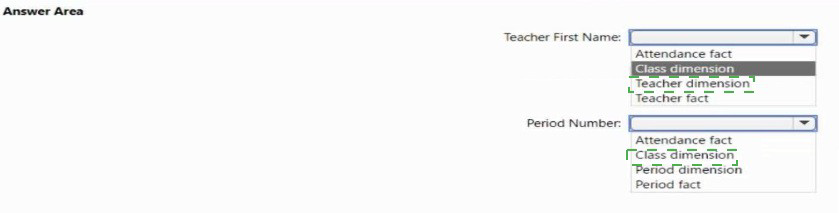
Explanation: Teacher dimension
Class dimension
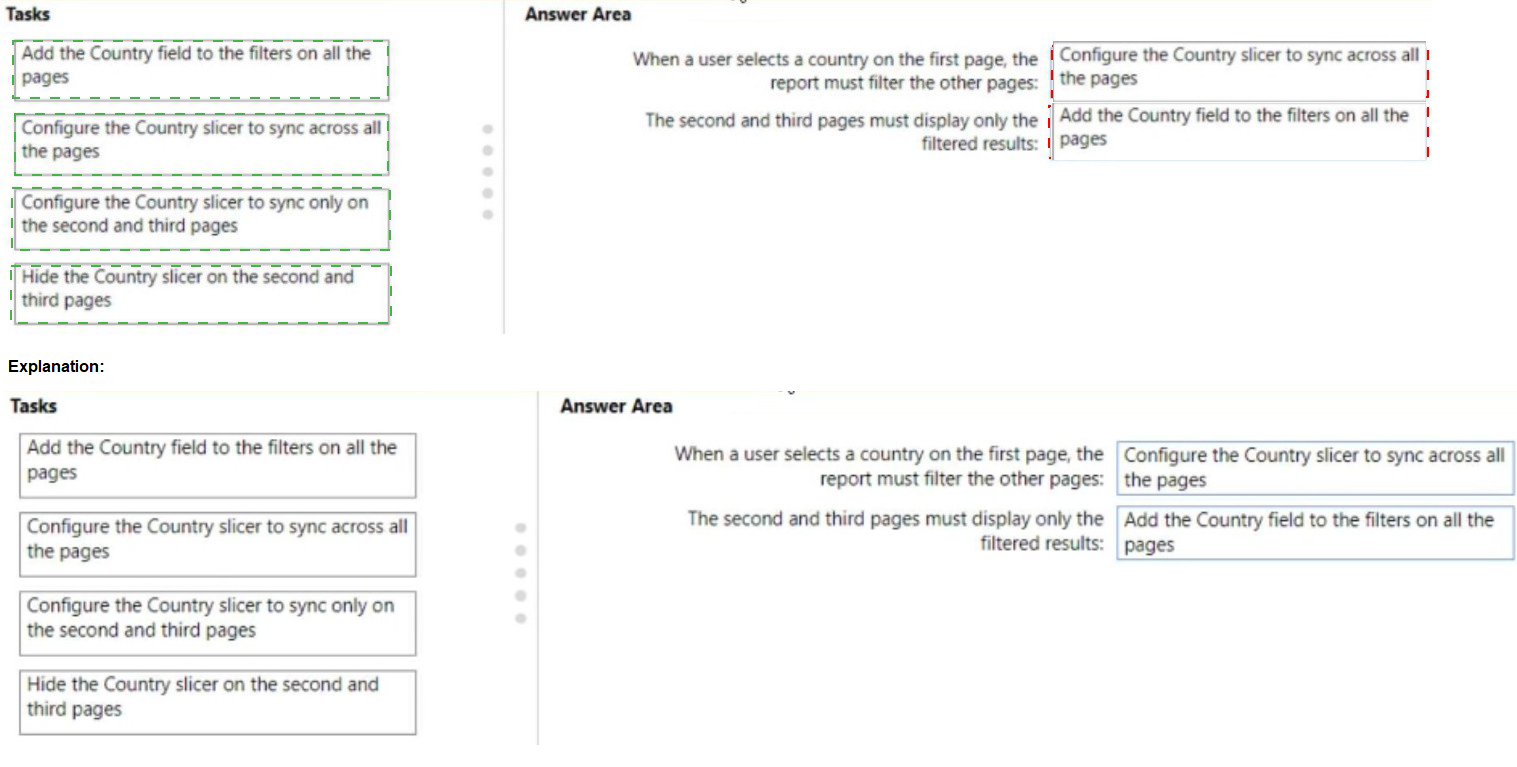
You have a Power Bl report that contains three pages. The pages are used to analyze sales across various countries.
You add a sheer named Country to each page of the report.
You need to configure the report to meet the following requirements:
• When a user selects a country on the first page, the report must filter the other pages.
• The second and third pages must display only the filtered results.
Which task should you perform for each requirement? To answer, drag the appropriate task to the correct requirement. Each task may be used once, more than once, or not at all. You may need to drag the split bar between panes or scroll to view content.
NOTE Each correct selection is worth one point.


| Page 5 out of 29 Pages |