Topic 4, Misc. Questions
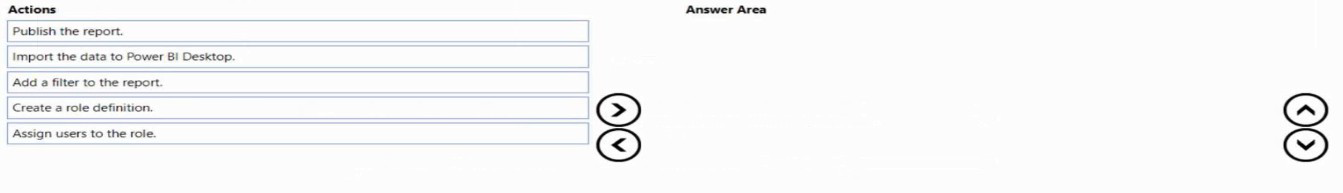
You plan to create a report that will display sales data from the last year for multiple regions.
You need to restrict access to individual rows of the data on a per region-basis by using roles.
Which four actions should you perform in sequence? To answer, move the appropriate actions from the list of actions to the answer area and arrange them in the correct order.
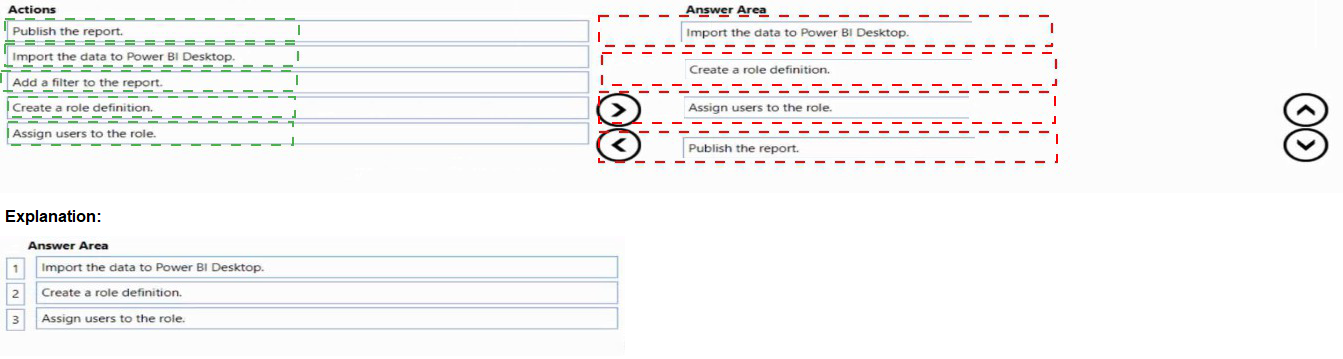
You plan to create the Power Bl model shown in the exhibit. (Click the Exhibit tab.)
The data has the following refresh requirements:
• Customer must be refreshed daily.
• Date must be refreshed once every three years.
• Sales must be refreshed in near real time.
• SalesAggregate must be refreshed once per week.
You need to select the storage modes for the tables. The solution must meet the following requirements:

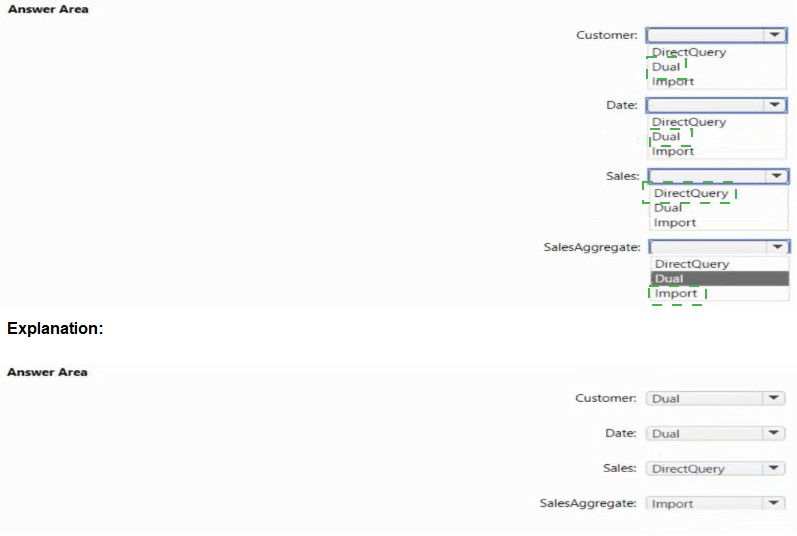
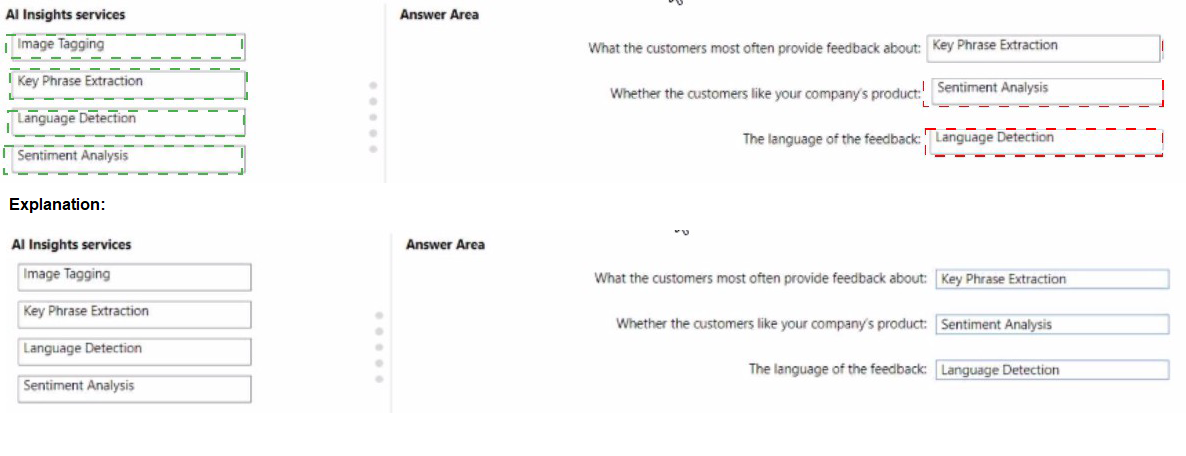
You use Power Query Editor to preview customer feedback data.
You need to use Al Insights to add a column of enhanced data based on the customer feedback. The solution must identify the following:
• What the customers most often provide feedback about
• Whether the customers like your company’s product
• The language of the feedback
Which Al Insights service should you use for each output? To answer, drag the appropriate services to the correct outputs. Each service may be used once, more than once. or not at all. You may need to drag the split bar between panes or scroll to view content.
NOTE: Each correct selection is worth one point.
You are creating a sales report in Power Bl for the NorthWest region sales territory of your company. Data will come from a view in a Microsoft SQL Server database. A sample of the data is shown in the following table:
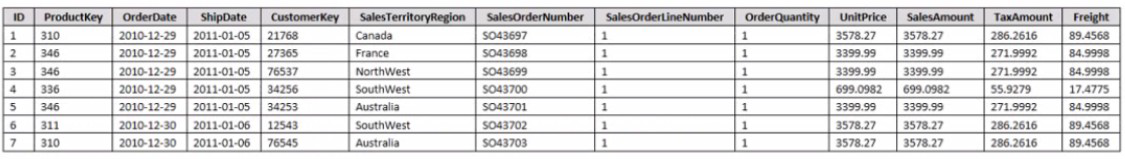
The report will facilitate the following analysis:
• The count of orders and the sum of total sales by Order Date
• The count of customers who placed an order
• The average quantity per order
You need to reduce data refresh times and report query times.
Which two actions should you perform? Each correct answer presents part of the solution.
NOTE: Each correct selection is worth one point.
A.
Fillet the data to only the NorthWest region sales territory.
B.
Remove the CustomerKey and ProductKey columns.
C.
Remove the TaxAmt and Freight columns.
D.
Set the data type for SatesOrderNumber to Decimal Number
Fillet the data to only the NorthWest region sales territory.
C.
Remove the TaxAmt and Freight columns.
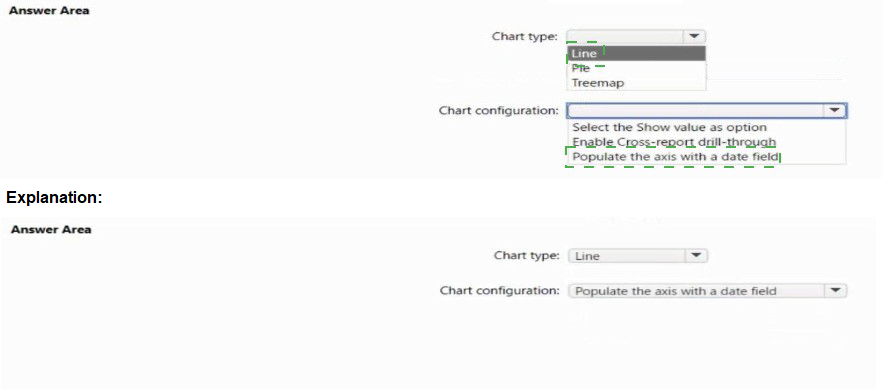
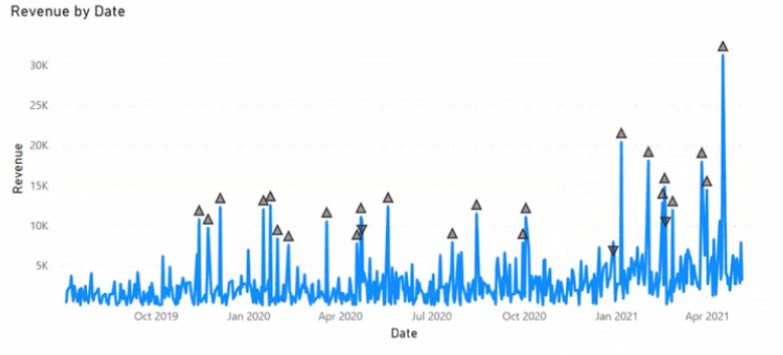
You have a dataset that contains revenue data from the past year.
You need to use anomaly detection in Power Bl to show anomalies in the dataset.
What should you configure? To answer, select the appropriate options in the answer area.
NOTE: Each correct selection is worth one point.

You are building a Power Bl report that uses data from an Azure SQL database named erp1. You Import the following tables.
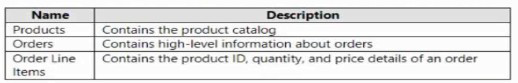
You need to perform the following analyses:
• Orders sold over time that include a measure of the total order value
• Orders by attributes of products sold
The solution must minimize update times when interacting with visuals in the report. What should you do first?
A.
From Power Query, merge the Orders query and the Order Line Hems query.
B.
Calculate the count of orders per product by using a DAX function.
C.
Create a calculated column that adds a list of product categories to the Orders table by using a DAX function.
D.
From Power Query, merge the Order Line Items query and the Products query.
From Power Query, merge the Order Line Items query and the Products query.
Explanation: https://www.sqlbi.com/articles/header-detail-vs-star-schema-models-intabular-and-power-bi/
You have a Power Bl visual that uses indicators to show values that are out of range as shown in the following exhibit.
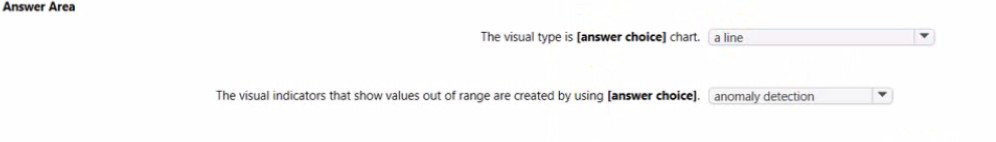
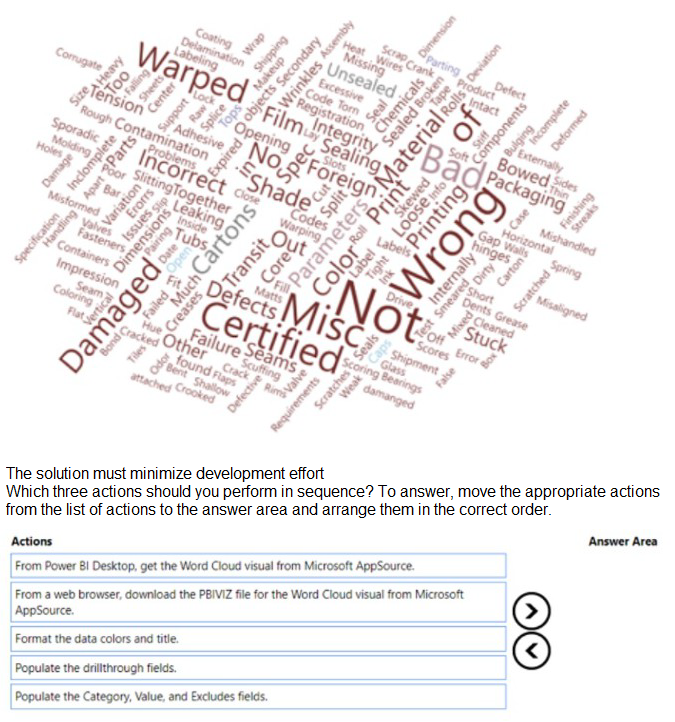
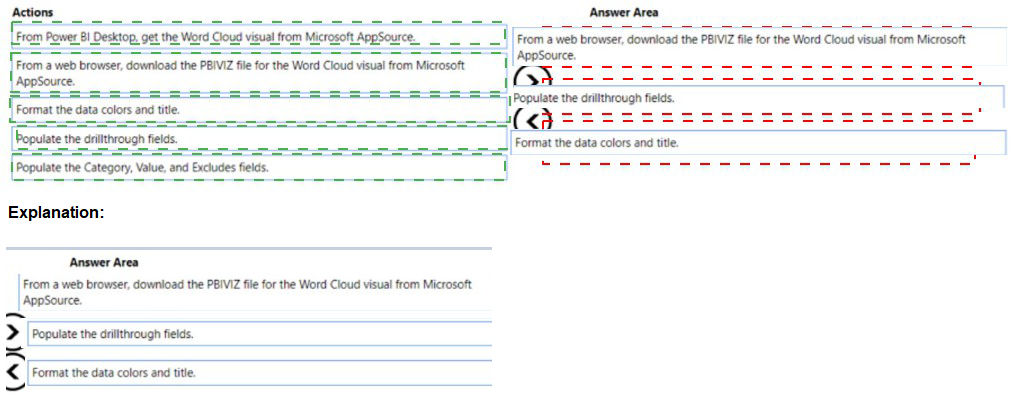
You use Power Bi Desktop to create a Power Bl data model and a blank report You need to add the Word Cloud visual shown in the following exhibit to the report.
| Page 4 out of 29 Pages |