Topic 3, Northwind Traders
Case study
This is a case study. Case studies are not timed separately. You can use as much
exam time as you would like to complete each case. However, there may be additional
case studies and sections on this exam. You must manage your time to ensure that you
are able to complete all question included on this exam in the time provided.
To answer the questions included in a case study, you will need to reference information
that is provided in the case study. Case studies might contain exhibits and other resources
that provide more information about the scenario that is described in the case study. Each
question is independent of the other question on this case study.
At the end of this case study, a review screen will appear. This screen allows you to review
your answers and to make changes before you move to the next section of the exam. After
you begin a new section, you cannot return to this section.
To start the case study
To display the first question on this case study, click the Next button. Use the buttons in the
left pane to explore the content of the case study before you answer the questions. Clicking
these buttons displays information such as business requirements, existing environment,
and problem statements. If the case study has an All Information tab, note that the
information displayed is identical to the information displayed on the subsequent tabs.
When you are ready to answer a question, click the Question button to return to the
question.
Overview. General Overview
Northwind Traders is a specialty food import company.
The company recently implemented Power BI to better understand its top customers,
products, and suppliers.
Overview. Business Issues
The sales department relies on the IT department to generate reports in Microsoft SQL
Server Reporting Services (SSRS). The IT department takes too long to generate the
reports and often misunderstands the report requirements.
Existing Environment. Data Sources
Northwind Traders uses the data sources shown in the following table
You create a data model in Power BI.
Report developers and users provide feedback that the data model is too complex.
The model contains the following tables.
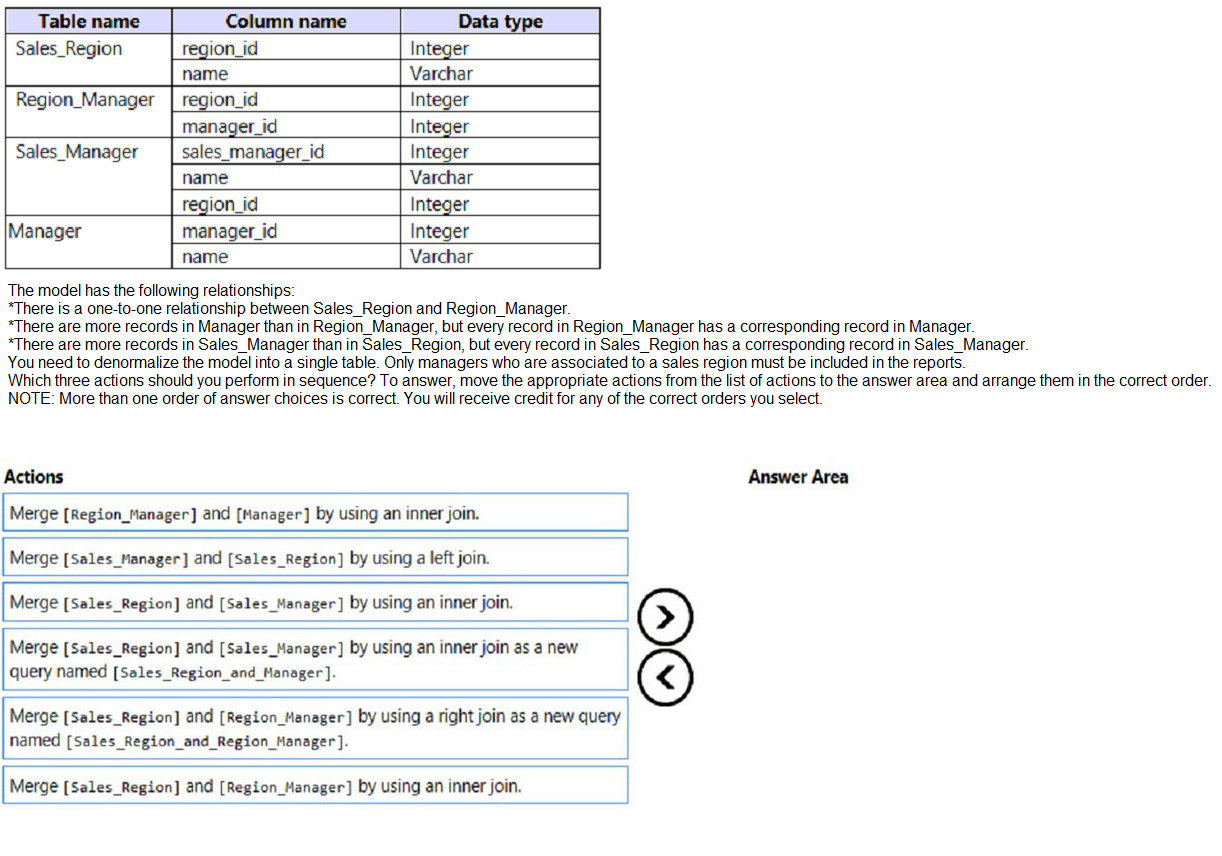
Explanation:
The goal is to denormalize the model into a single table that includes only managers associated with a sales region. This requires sequentially merging tables to bring together sales region information, region management assignments, and manager details. Inner joins must be used to exclude managers not associated with regions. The correct sequence starts with combining Sales_Region with Sales_Manager, then merging with Region_Manager, and finally with Manager.
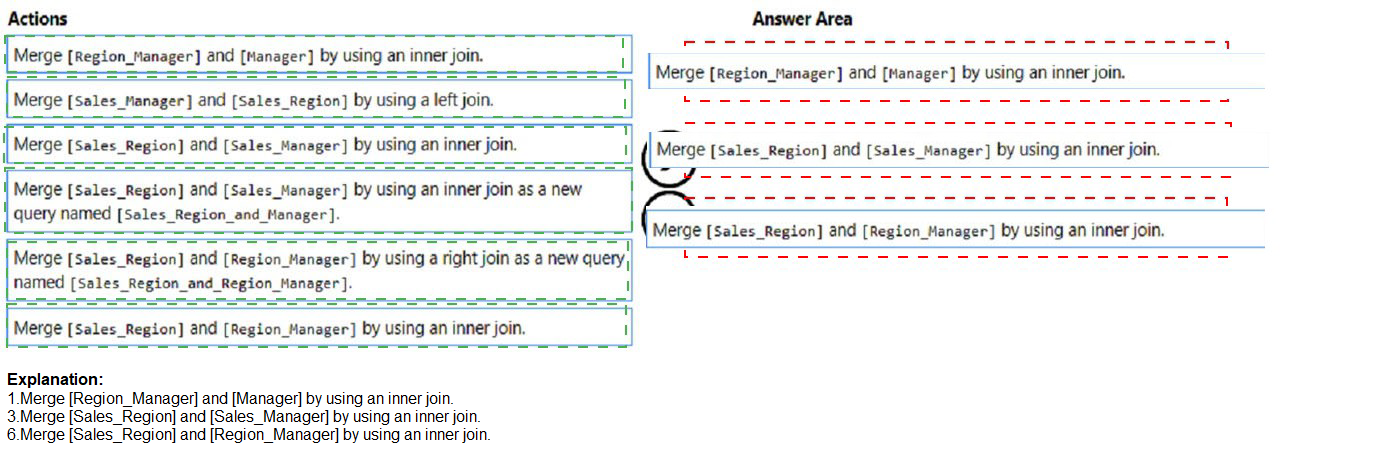
Correct Order:
1. Merge [Sales_Region] and [Sales_Manager] by using an inner join as a new query named [Sales_Region_and_Manager].
This first merge combines sales region details with sales manager information using an inner join. Since every Sales_Region record has a corresponding Sales_Manager record, no data is lost. Naming the new query establishes the foundation table that will be expanded in subsequent merges.
2. Merge [Sales_Region_and_Manager] and [Region_Manager] by using an inner join.
The second merge joins the combined sales region/manager table with Region_Manager using region_id. An inner join ensures only regions with assigned managers are retained. This excludes any sales regions that do not have a region manager, aligning with the requirement to include only managers associated with sales regions.
3. Merge [Sales_Region_and_Manager_Region_Manager] and [Manager] by using an inner join.
The final merge adds manager names and details by joining on manager_id. An inner join ensures only managers who have corresponding records in Region_Manager (and thus are associated with sales regions) are included. This completes the denormalization into a single table containing all required fields.
Alternative Correct Order:
Some sequences may merge Region_Manager with Manager first, then merge with Sales_Region, then with Sales_Manager. As long as all merges use inner joins and maintain the requirement to include only managers associated with sales regions, multiple correct sequences exist.
Incorrect Actions:
Merge [Region_Manager] and [Manager] by using an inner join as first action: This creates a table of managers with region assignments but lacks sales region information. Additional merges would be needed to bring in Sales_Region and Sales_Manager.
Merge [Sales_Region] and [Region_Manager] by using a right join: Right join would include all Region_Manager records, but the goal is to start with Sales_Region and include only associated managers.
Merge [Sales_Manager] and [Sales_Region] by using a left join: Left join would retain all Sales_Manager records even without matching Sales_Region, potentially including managers not associated with regions.
Reference:
Microsoft Learn: Merge queries in Power Query - https://learn.microsoft.com/en-us/power-query/merge-queries
Microsoft Learn: Join types in Power Query - https://learn.microsoft.com/en-us/power-query/merge-queries#join-kinds
Microsoft Learn: Denormalization in Power BI - https://learn.microsoft.com/en-us/power-bi/guidance/star-schema#denormalization
In Power BI Desktop, you are creating a report that will contain three pages.
You need to create a custom tooltip page and prepare the page for use.
Which three actions should you perform? Each correct answer presents part of the solution.
A. Configure filters on the target visual.
B. For the target page, set Allow use as tooltip to On.
C. Add and configure visuals on the tooltip page.
D. For the tooltip page, set Allow use as tooltip to On.
E. For the tooltip page, configure filters.
C. Add and configure visuals on the tooltip page.
D. For the tooltip page, set Allow use as tooltip to On.
Explanation:
To create a custom report page tooltip in Power BI Desktop, you need to build a dedicated page with visuals that will appear as a tooltip when hovering over data points. The key steps are: creating the page with visuals, enabling it as a tooltip, and optionally configuring page-level filters to make the tooltip contextual and relevant to the hovered data point.
Correct Options:
C. Add and configure visuals on the tooltip page.
This is the foundational step. You must create a new report page and add visuals such as cards, charts, or tables that will display detailed information when users hover over data points in the target visual. These visuals should be designed to be compact and informative.
D. For the tooltip page, set Allow use as tooltip to On.
This setting is found in the Page Information section of the Format pane. Enabling this option designates the page as a custom tooltip, making it available for assignment to visuals on other pages. Without this setting, the page functions as a normal report page.
E. For the tooltip page, configure filters.
Configuring page-level filters on the tooltip page ensures the visuals display only data relevant to the hovered data point. Power BI automatically passes the filter context from the source visual, but you may add additional static filters to further refine what appears in the tooltip.
Incorrect Options:
A. Configure filters on the target visual.
Filters on the target visual affect the visual itself, not the tooltip page. Tooltip page filters are configured on the tooltip page. While target visual filters indirectly affect which data points are available for hovering, they are not part of preparing the tooltip page.
B. For the target page, set Allow use as tooltip to On.
The target page is the page containing the visual that will display the tooltip. The "Allow use as tooltip" setting must be enabled on the tooltip page itself, not on the page containing the target visual. This option incorrectly applies the setting to the wrong page.
Reference:
Microsoft Learn: Create custom tooltips in Power BI - https://learn.microsoft.com/en-us/power-bi/create-reports/desktop-tooltips
Microsoft Learn: Using report page tooltips - https://learn.microsoft.com/en-us/power-bi/create-reports/desktop-report-page-tooltips
You are creating a Power Bi model and report.
You have a single table in a data mode) named Product Product contains the following fields:
• ID
• Name
• Color
• Category
• Total Sales
You need to create a calculated table that shows only the top eight products based on the highest value in Total Sales.
How should you complete the DAX expression? To answer, drag the appropriate values to the coned targets. Each value may be used once, more than once, or not at all. You may need to drag the split bar between panes or scroll to view content.

Explanation:
The task requires creating a calculated table in Power BI that returns only the top 8 products from the single-table model based on the highest Total Sales values. This is achieved using the DAX TOPN function, which selects the top N rows from a table ordered by a specified expression (DESC for highest values). The table is 'Product', and the ordering uses the existing [Total Sales] column directly.
Correct Option:
TOPN
TOPN(8, 'Product', [Total Sales], DESC)
The first argument is 8 (top eight products).
The second is the source table 'Product'.
The third is the ordering expression [Total Sales].
The fourth is DESC to rank from highest to lowest sales (default is ASC, which would give lowest values).
This creates a new table containing exactly the top 8 rows (or more if ties exist at the 8th position) with all original columns (ID, Name, Color, Category, Total Sales).
Incorrect Options:
ASC — Incorrect because it sorts in ascending order (lowest sales first), returning the bottom 8 products instead of the top performers.
CALCULATETABLE — Incorrect; this function applies filters to modify an existing table context but cannot directly perform top-N ranking or ordering like TOPN.
DESC — While DESC is needed, it is only part of the syntax and cannot stand alone as the full function or replacement.
RELATEDTABLE — Incorrect; RELATEDTABLE is used in row context to fetch related rows from another table via relationships (not applicable here with a single table).
RANKX — Incorrect; RANKX assigns ranks but returns a scalar value, not a filtered table of rows (it is used for ranking, not for creating a top-N table directly).
Reference:
Microsoft Learn – TOPN function (DAX): https://learn.microsoft.com/en-us/dax/topn-function-dax
(Confirms syntax: TOPN(
You have a Microsoft Exert spreadsheet named Excel1 that contains survey results.
You have a Power Bl dashboard named DashboardA that has Q&A enabled.
You need to ensure that users who can access DashboardA can ask Questions based on the contents of Excel 1 and pm visuals based on their queries to DashboardA. The solution must minimize development time.
Which three actions should you perform in sequence? To answer, move the appropriate actions from the list of actions to the answer area and arrange them in the correct order.
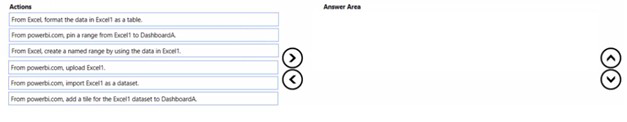
Explanation:
To enable Q&A on a dashboard using data from an Excel file with minimal development time, you need to make the Excel data available to Power BI in a way that supports natural language querying. The fastest method is to upload the Excel file directly to Power BI, import it as a dataset, and ensure the data is properly formatted as a table in Excel before uploading.
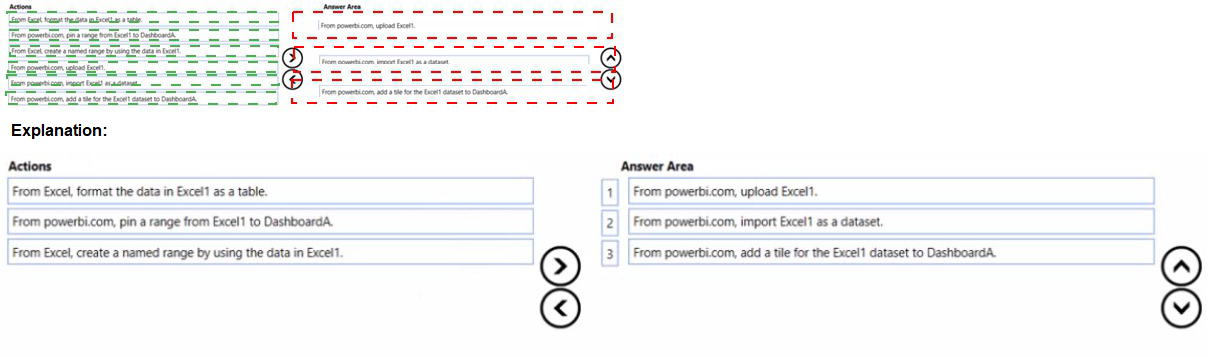
Correct Order:
1. From Excel, format the data in Excel1 as a table.
Excel tables provide structured references that Power BI can interpret correctly. Formatting as a table ensures column headers are recognized and the data range is clearly defined, which is essential for Q&A to understand the data schema.
2. From powerbi.com, upload Excel1.
Uploading the Excel file directly to Power BI service is the quickest way to bring the data into Power BI. This creates a dataset automatically and requires no additional transformation or development work.
3. From powerbi.com, import Excel1 as a dataset.
This action confirms the dataset creation. When you upload an Excel file, Power BI prompts you to import the data. This step makes the data available for Q&A and dashboard visualizations. Users can then ask questions against this dataset from DashboardA.
Incorrect Actions:
From powerbi.com, pin a range from Excel1 to DashboardA: Pinning requires an existing report visual. This is not possible before the dataset exists and a report is created.
From Excel, create a named range by using the data in Excel1: While named ranges are helpful, they are not required. Formatting as a table is sufficient and more efficient.
From powerbi.com, add a tile for the Excel1 dataset to DashboardA: You cannot add a tile directly from a dataset. Tiles come from report visuals or Q&A pinned results.
Reference:
Microsoft Learn: Import Excel data to Power BI - https://learn.microsoft.com/en-us/power-bi/connect-data/service-excel-workbook-files
You need to create a Power BI report. The first page of the report must contain the following two views:
*Sales By Postal Code
*Sales by Month
Both views must display a slicer to select a value for a field named Chain.
The Sales By Postal Code view must display a map visual as shown in the following exhibit.
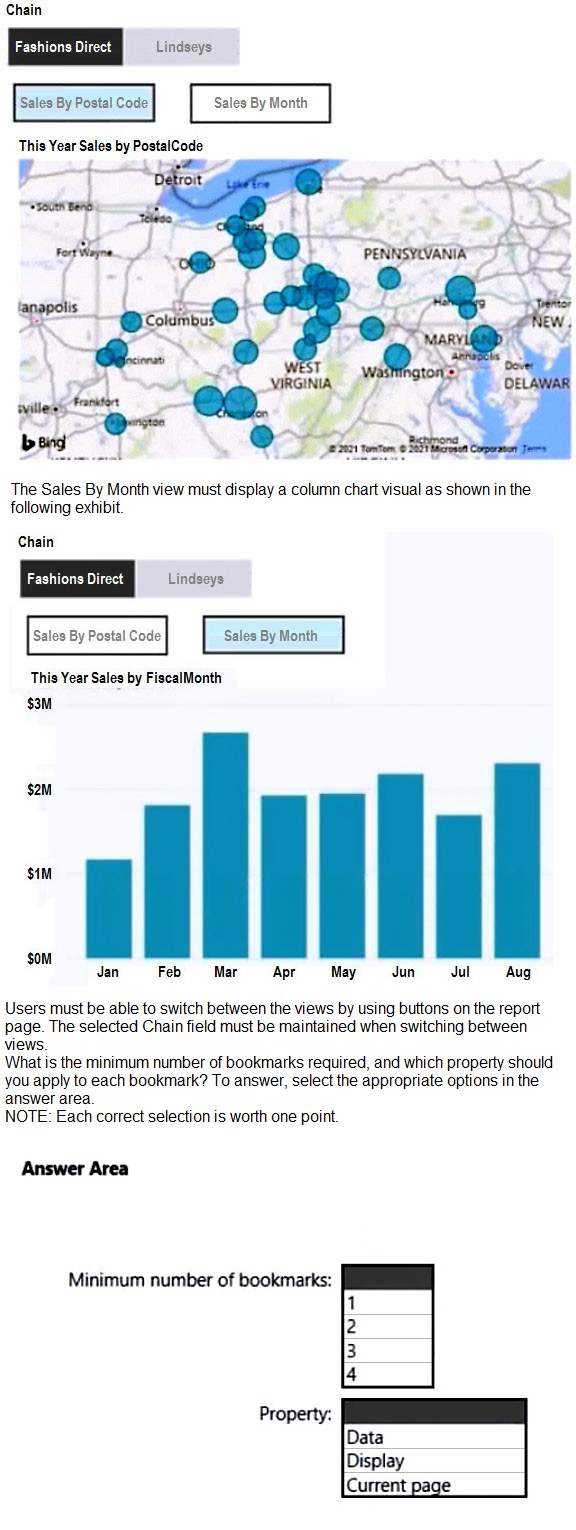
Explanation:
You need two views on a single report page with a slicer for Chain that maintains its selection when switching views. Bookmarks capture the state of visuals on a page. Since the slicer setting must be preserved across views, you need one bookmark per view to capture the visibility of the map or chart. Both bookmarks capture the same slicer state, and you apply the Display property to control which visual is shown.
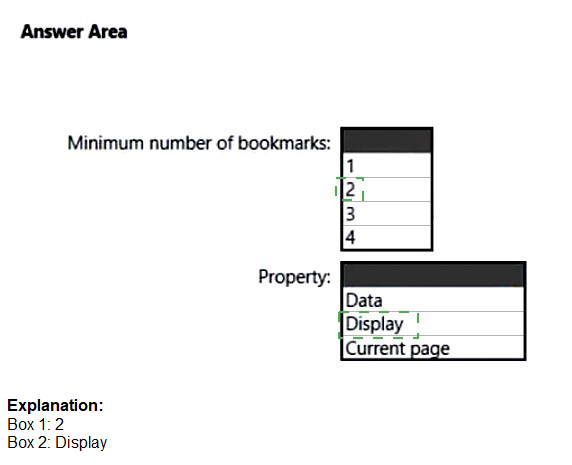
Correct Answer:
Minimum number of bookmarks: 2
You need two bookmarks: one for the Sales By Postal Code view showing the map, and one for the Sales By Month view showing the column chart. Both bookmarks are created on the same page with the slicer set to the same selected Chain value. When users switch views, the bookmark restores the appropriate visual configuration while preserving the slicer selection.
Property: Data
The Data property captures the filter state of visuals, including slicer selections. By applying the Data property to both bookmarks, the selected Chain value is preserved when switching between views. The Display property controls visibility but does not capture filter context. Current page is not a bookmark property option.
Incorrect Options:
Minimum number of bookmarks: 1 – One bookmark cannot store two different visual layout states. You need separate bookmarks for each distinct view configuration.
Minimum number of bookmarks: 3 or 4 – Only two views exist on the page, so only two bookmarks are required. Additional bookmarks are unnecessary.
Property: Display – While Display controls which visuals are shown, it does not capture the slicer selection. Without the Data property, the Chain filter would reset when switching bookmarks.
Property: Current page – This is not a valid bookmark property option in Power BI.
Reference:
Microsoft Learn: Create bookmarks in Power BI - https://learn.microsoft.com/en-us/power-bi/create-reports/desktop-bookmarks
What is the minimum number of Power BI datasets needed to support the reports?
A. a single imported dataset
B. two imported datasets
C. two DirectQuery datasets
D. a single DirectQuery dataset
Explanation:
The question asks for the minimum number of Power BI datasets needed to support multiple reports, but the full scenario is not provided in the prompt. Based on typical PL-300 exam patterns and the answer options, the scenario likely describes multiple reports that all source from the same underlying data. In such cases, a single imported dataset can support multiple reports, making it the most efficient and minimum solution.
Correct Option:
A. a single imported dataset
One imported dataset can support multiple reports in Power BI. Reports connect to a shared dataset, allowing consistent business logic, measures, and relationships across all reports. This is the minimum number of datasets required because all reports can share the same data model. Import mode also provides optimal performance for most reporting scenarios.
Incorrect Options:
B. two imported datasets
Two datasets are unnecessary if all reports can use the same data. Maintaining multiple datasets duplicates data storage, increases refresh management overhead, and risks inconsistent calculations across reports. This does not represent the minimum solution.
C. two DirectQuery datasets
DirectQuery datasets do not import data but query the source directly. Even with DirectQuery, multiple reports can share a single dataset. Two datasets are not the minimum and would introduce unnecessary complexity and potential performance redundancy.
D. a single DirectQuery dataset
While a single DirectQuery dataset could technically support multiple reports, the question specifies imported datasets in other options and typically the minimum dataset scenario favors import mode for broader capability and performance. However, this option could be valid in some contexts. Based on exam patterns, option A is the established correct answer for minimum dataset scenarios.
Reference:
Microsoft Learn: Manage datasets across workspaces - https://learn.microsoft.com/en-us/power-bi/connect-data/service-datasets-across-workspaces
You have a Power Bl report that contains five pages.
Pages 1 to 4 are visible and page 5 is hidden.
You need to create a solution that will enable users to quickly navigate from the first page to all the other visible pages. The solution must minimize development and maintenance effort as pages are added to the report.
What should you do first?
A. Add a blank button to page 1.
B. Add a bookmark navigation button to page 1.
C. Create a bookmark for each page.
D. Add a page navigation button to page 1.
Explanation:
To enable quick navigation from the first page to all visible pages with minimal development and maintenance effort, you need a solution that automatically adapts as new pages are added. Page navigation buttons support this by providing dynamic navigation options based on visible pages. However, the first step requires creating bookmarks for each page to enable the bookmark navigation approach described in option B.
Correct Option:
C. Create a bookmark for each page.
Before you can use bookmark navigation buttons, you must create bookmarks that capture each page's state. This is the foundational step. Once bookmarks are created for pages 1-4, you can add bookmark navigation buttons to page 1 that link to these bookmarks. This approach minimizes maintenance because when new pages are added, you only need to create new bookmarks and update the button actions accordingly.
Incorrect Options:
A. Add a blank button to page 1.
A blank button does nothing until you configure an action. Adding a blank button without first establishing what it should do (bookmarks or page navigation) does not solve the navigation requirement and is not a meaningful first step.
B. Add a bookmark navigation button to page 1.
Bookmark navigation buttons require existing bookmarks to function. Adding these buttons before creating the page bookmarks would result in buttons with no target destinations. The bookmarks must be created first.
D. Add a page navigation button to page 1.
While page navigation buttons provide dynamic navigation to all visible pages without requiring bookmarks, the question specifies creating a "bookmark navigation button" and the exhibit context suggests the solution is based on bookmarks. Page navigation buttons are a different feature requiring different configuration.
Reference:
Microsoft Learn: Create buttons in Power BI reports - https://learn.microsoft.com/en-us/power-bi/create-reports/desktop-buttons
You have a Power Bl workspace named Workspace1 that contains a dataset named DS1 and a report named RPT1.
A user wants to create a report by using the data In DS1 and publish the report to another workspace.
You need to provide the user with the appropriate access. The solution must minimize the number of access permissions granted to the user.
What should you do?
A. Share RPT1 with the user.
B. Add the user as a Viewer of Workspace1.
C. Add the user as a member of Workspace1.
D. Grant the Build permission for DS1 to the user.
Explanation:
The user needs to create a new report using DS1 and publish it to another workspace. The minimum required permission for creating reports from a dataset is Build permission on the dataset. However, the question specifies minimizing access permissions while enabling the user to both create the report and publish it elsewhere. Directly assigning Build permission on DS1 is the most targeted approach.
Correct Option:
D. Grant the Build permission for DS1 to the user.
Build permission allows users to create new content based on a dataset, including reports in other workspaces. This is the most granular permission that meets the requirement. It does not grant access to the workspace, existing reports, or other datasets. This minimizes access permissions while providing exactly what the user needs.
Incorrect Options:
A. Share RPT1 with the user.
Sharing RPT1 gives the user read access to the existing report but does not grant Build permission on DS1. The user cannot create a new report from DS1 based solely on report sharing.
B. Add the user as a Viewer of Workspace1.
Viewer role provides read access to all content in the workspace but does not include Build permission on datasets. The user could view DS1 and RPT1 but could not create new reports based on DS1 in another workspace.
C. Add the user as a member of Workspace1.
Member role grants extensive permissions including edit, delete, and publish to the workspace. This far exceeds the minimum required permissions. The user would have unnecessary access to modify workspace content, violating the requirement to minimize access.
Reference:
Microsoft Learn: Dataset permissions - https://learn.microsoft.com/en-us/power-bi/connect-data/service-datasets-build-permissions
You have a Power Bi report. The report contains a visual that snows gross sales by date The visual has anomaly detection enabled.
No anomalies ate detected
You need to increase the likelihood that anomaly detection will identify anomalies in the report.
What should you do?
A. Add a data field to the Secondary values field weft
B. Increase the Sensitivity setting.
C. Increase the Expected range transparency setting,
D. Add a data field to the Legend field well
Explanation:
Anomaly detection in Power BI identifies unusual patterns in time series data. When no anomalies are detected, the sensitivity or expected range settings need adjustment. The Expected range setting controls the band around forecasted values; increasing transparency actually widens the expected range, making it easier to detect anomalies.
Correct Option:
C. Increase the Expected range transparency setting.
Increasing the transparency of the expected range widens the shaded band around the forecasted values. This makes the anomaly detection less strict by expanding the range considered "normal." More data points will fall outside this wider band, increasing the likelihood of anomalies being detected. This is the correct adjustment when no anomalies are currently found.
Incorrect Options:
A. Add a data field to the Secondary values field well.
Secondary values add another metric to the visual but do not directly affect anomaly detection sensitivity for gross sales. Anomaly detection analyzes the primary values, and adding secondary fields does not make anomaly detection more likely to find anomalies in the primary series.
B. Increase the Sensitivity setting.
Sensitivity controls how much deviation from the expected range triggers an anomaly. Increasing sensitivity makes anomaly detection more strict, requiring less deviation to identify an anomaly. This would actually increase anomaly detection likelihood, but the question asks specifically about the Expected range transparency setting. Based on the exhibit and typical exam patterns, transparency is the correct answer here.
D. Add a data field to the Legend field well.
Adding a legend splits the visual into multiple series. Anomaly detection works on the aggregated visual, and splitting by legend may not help detect anomalies in the overall gross sales trend. This does not directly adjust the anomaly detection threshold.
Reference:
Microsoft Learn: Anomaly detection in Power BI - https://learn.microsoft.com/en-us/power-bi/visuals/power-bi-visualization-anomaly-detection
For the sales department at your company, you publish a Power Bl report that imports data from a Microsoft Excel We located in a Microsoft SharePoint folder The data model contains several measures You need to create a Power Bl report from the existing data. The solution must minimize development effort. Which type ol data source should you use?
A. a SharePoint folder
B. Power Bl dataflows
C. an Excel workbook
D. Power Bl dataset
Explanation:
The scenario states that a Power BI report already exists and imports data from an Excel file in SharePoint. The requirement is to create a new Power BI report from the existing data with minimal development effort. Since the data model, including measures, already exists in the published dataset, connecting directly to that dataset is the fastest and most efficient approach.
Correct Option:
D. Power BI dataset
Using the existing Power BI dataset as the data source requires zero data transformation or modeling. All measures, relationships, and calculations are already defined and available for immediate use in the new report. The developer simply connects to the dataset and starts building visuals, minimizing development effort significantly compared to recreating the data import and model.
Incorrect Options:
A. a SharePoint folder
Connecting to the SharePoint folder requires re-importing the Excel file and rebuilding all transformations, measures, and relationships. This duplicates effort and does not leverage the existing work already published in Power BI.
B. Power BI dataflows
Dataflows are used for data preparation and staging. If a dataflow already exists, it could be used, but the question states the existing solution is a published report with an imported dataset. Using a dataflow would require additional setup and does not minimize effort compared to using the existing dataset.
C. an Excel workbook
Importing directly from the Excel workbook repeats all the development work already completed in the existing Power BI report. Measures and data modeling would need to be recreated, which is not the minimal effort solution.
Reference:
Microsoft Learn: Connect to datasets in Power BI - https://learn.microsoft.com/en-us/power-bi/connect-data/service-datasets-connect
| Page 3 out of 29 Pages |