Topic 4, Misc. Questions

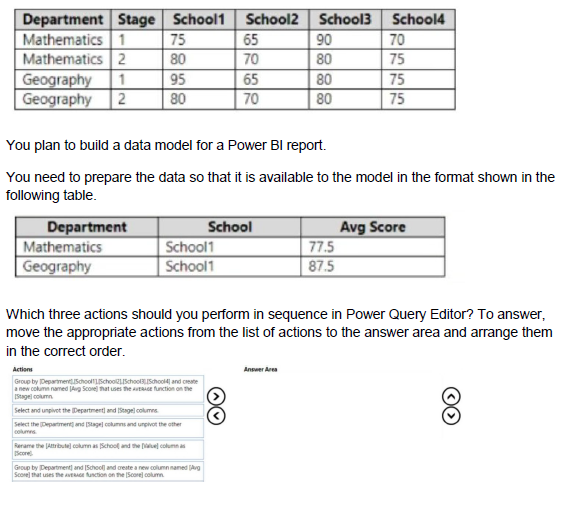
You have a Microsoft Excel spreadsheet that contains the data shown in the following table.


You have a Power BI report named Report' and a dashboard named Dashboard'. Report1 contains a line chart named Sales by month.
You pin the Sales by month visual to Dashboard1.
In Report1, you change the Sales by month visual to a bar chart.
You need to ensure that the bar chart displays on Dashboard', What should you do?

A.

Refresh the dataset used by Report1 and Dashboard1.

B.

Select Refresh visuals for Dashboard1.

C.

Edit the details for the dashboard tile Of Dashboar1.

D.

Pin the Sales by month bar chart to Dashboard1.

A.   

Refresh the dataset used by Report1 and Dashboard1.


You have a report that contains a donut chart and a clustered column chart. Interactions between the visuals use the default settings. You need to modify the report so that when you select a column m the column chart, the donut chart redraws by using the data from the selected column. What should you do?


A.

Select the column chart and set the donut chart interaction to None.

B.

Select the column chart and set the donut chart interaction to Filter.

C.

Select the donut chart and set the column chart interaction to Filter.

D.

Select the donut chart and set the column chart interaction to None.

B.   

Select the column chart and set the donut chart interaction to Filter.


You have a Power B1 model that contains a table named Date. The table has the following columns.


You are creating a Power Bi model in Power BI Desktop.
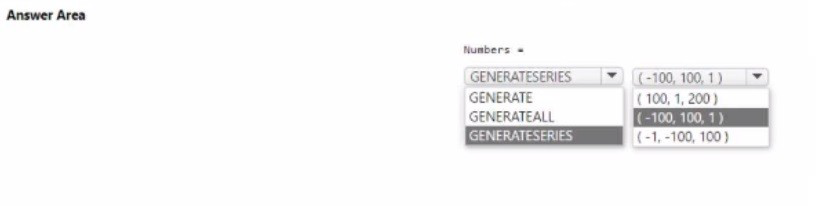
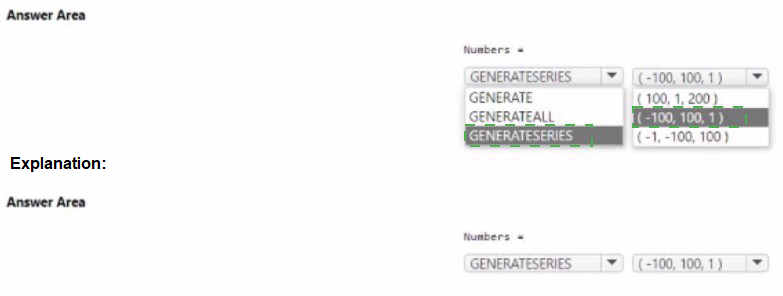
You need to create a calculated table named Numbers that will contain all the integers from -100 to 100. How should you complete the DAX calculation? To answer, select the appropriate options in the answer area. NOTE Each correct selection is worth one point.


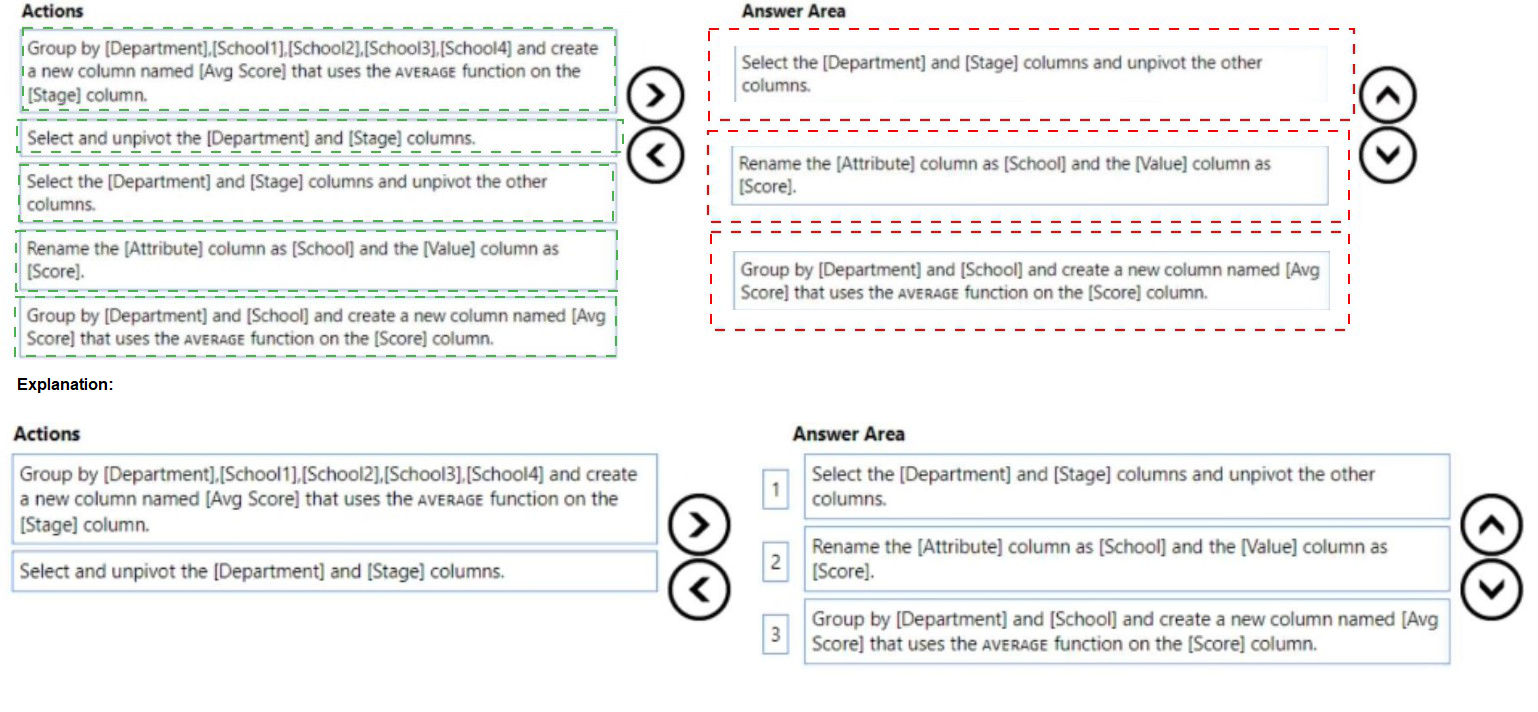
You are building a data model for a Power Bl report. You have data formatted as shown in the following table.
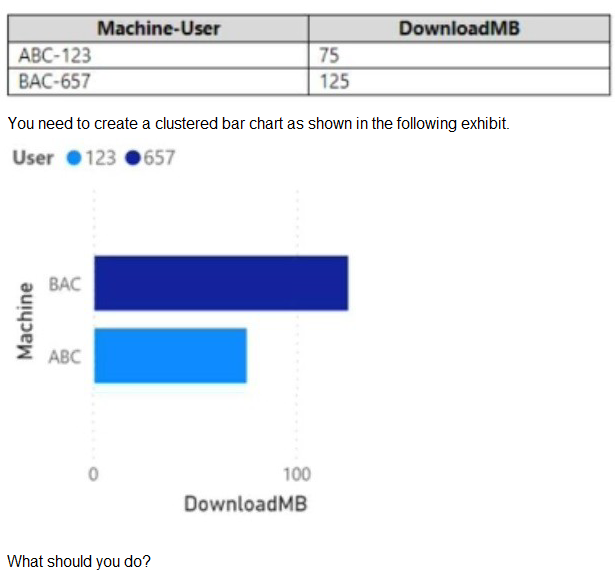
A.

From Power Query Editor, split the Machine-User column by using a delimiter.

B.

In a DAX function, create two calculated columns named Machine and User by using the substitute function.

C.

From Power Query Editor, create a column that contains the last three digits of the Machine-User column.

D.

in a DAX function, create two measures named Machine and User by using the substitute function.

A.   

From Power Query Editor, split the Machine-User column by using a delimiter.


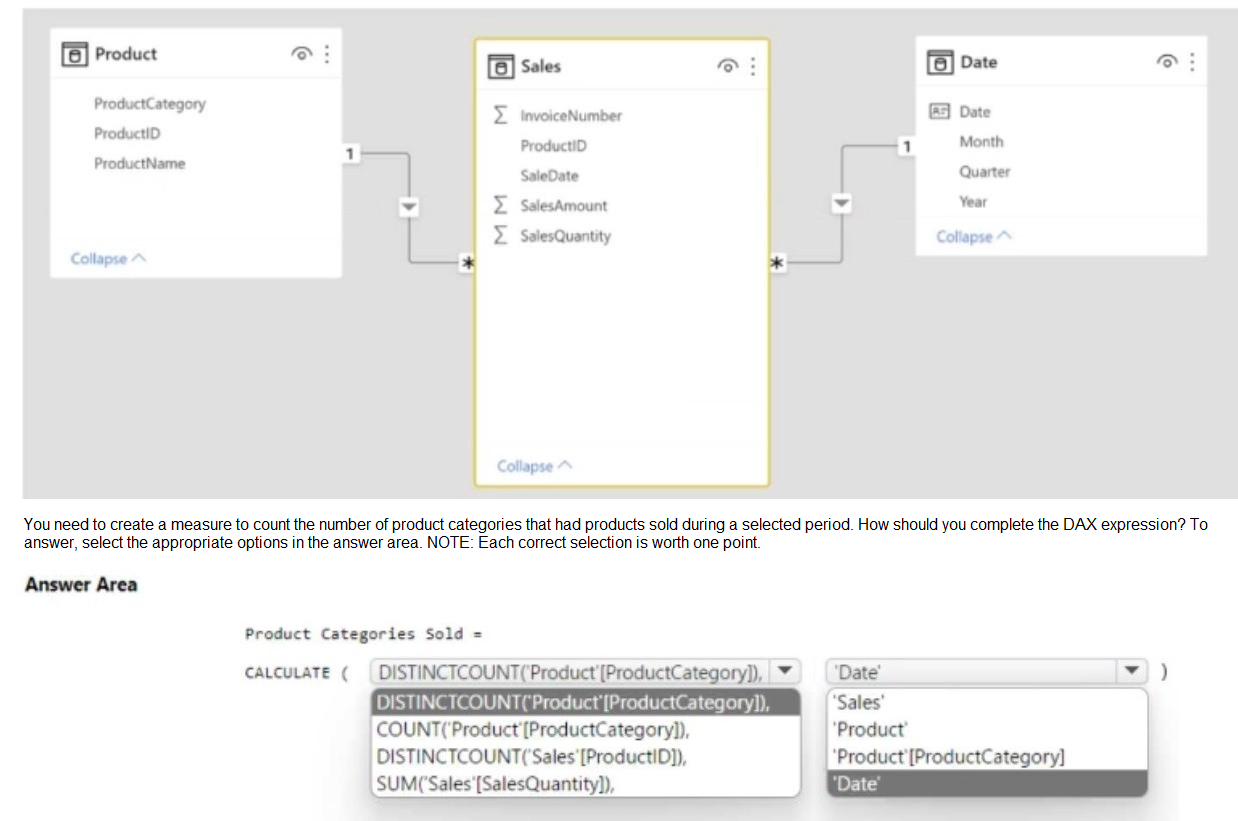
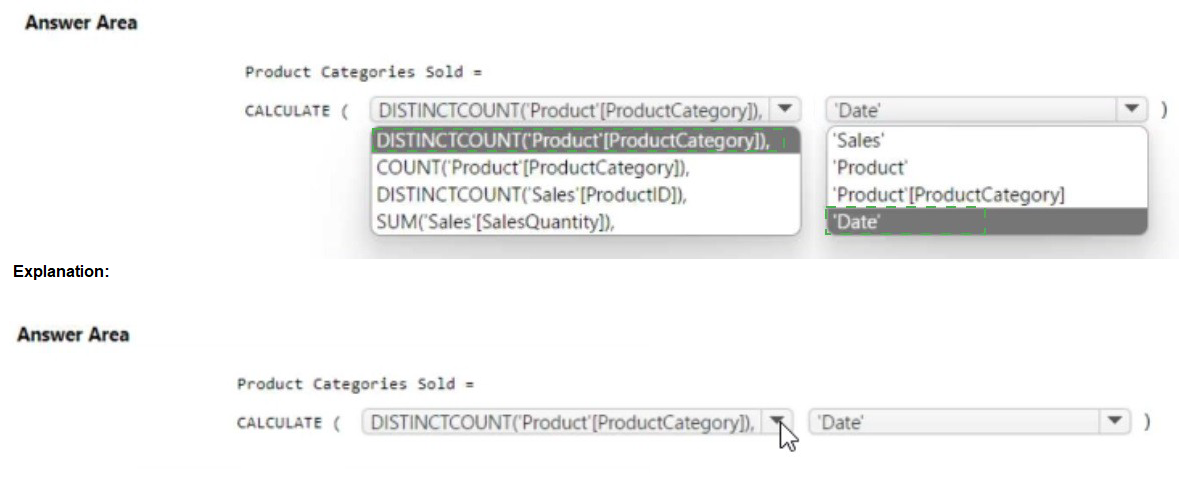
You have the Power Bl data model shown in the following exhibit.


You have a Power Bl workspace named Inventory that contains a dataset a report and a dashboard.
You need to add an additional tile to the dashboard. The tile must show inventory by location. This information is NOT visualized in the report. The solution must minimize the impact on the report.
Which two actions should you perform? Each correct answer presents part of the solution.
NOTE: Each correct selection is worth one point.

A.

Use quick insights on the dashboard.

B.

Hide the report page.

C.

Ask a question by using Q&A.

D.

Add the visual to the report.

E.

Pin the visual to the dashboard

C.   

Ask a question by using Q&A.


E.   

Pin the visual to the dashboard


You import a Power Bl dataset that contains the following tables:

• Date
• Product
• Product Inventory

The Product inventory table contains 25 million rows. A sample of the data is shown in the following table.

The Product Inventory table relates to the Date table by using the DateKey column. The Product inventory table relates to the Product table by using the ProductKey column. You need to reduce the size of the data model without losing information. What should you do?

A.

Change Summarization for DateKey to Don't Summarize

B.

Change the data type of UnitCost to Integer.

C.

Remove the relationship between Date and Product Inventory.

D.

Remove MovementDate

D.   

Remove MovementDate


You build a Power Bi report that displays loT temperature data streaming from a refrigerator. You publish the report to the Power BI service. You need to be notified when the temperature rises above four degrees Celsius. What should you do?

A.

Set an alert on a KPI visual in the report.

B.

Pin a card visual to a dashboard and create a subscription.

C.

Pin a card visual to a dashboard and set an alert on the tile.

D.

Pin a report page to a dashboard and set an alert on the page.

D.   

Pin a report page to a dashboard and set an alert on the page.


Page 10 out of 29 Pages