Topic 3, Mix Questions
You configure version control for an Azure Data Factory instance as shown in the following exhibit.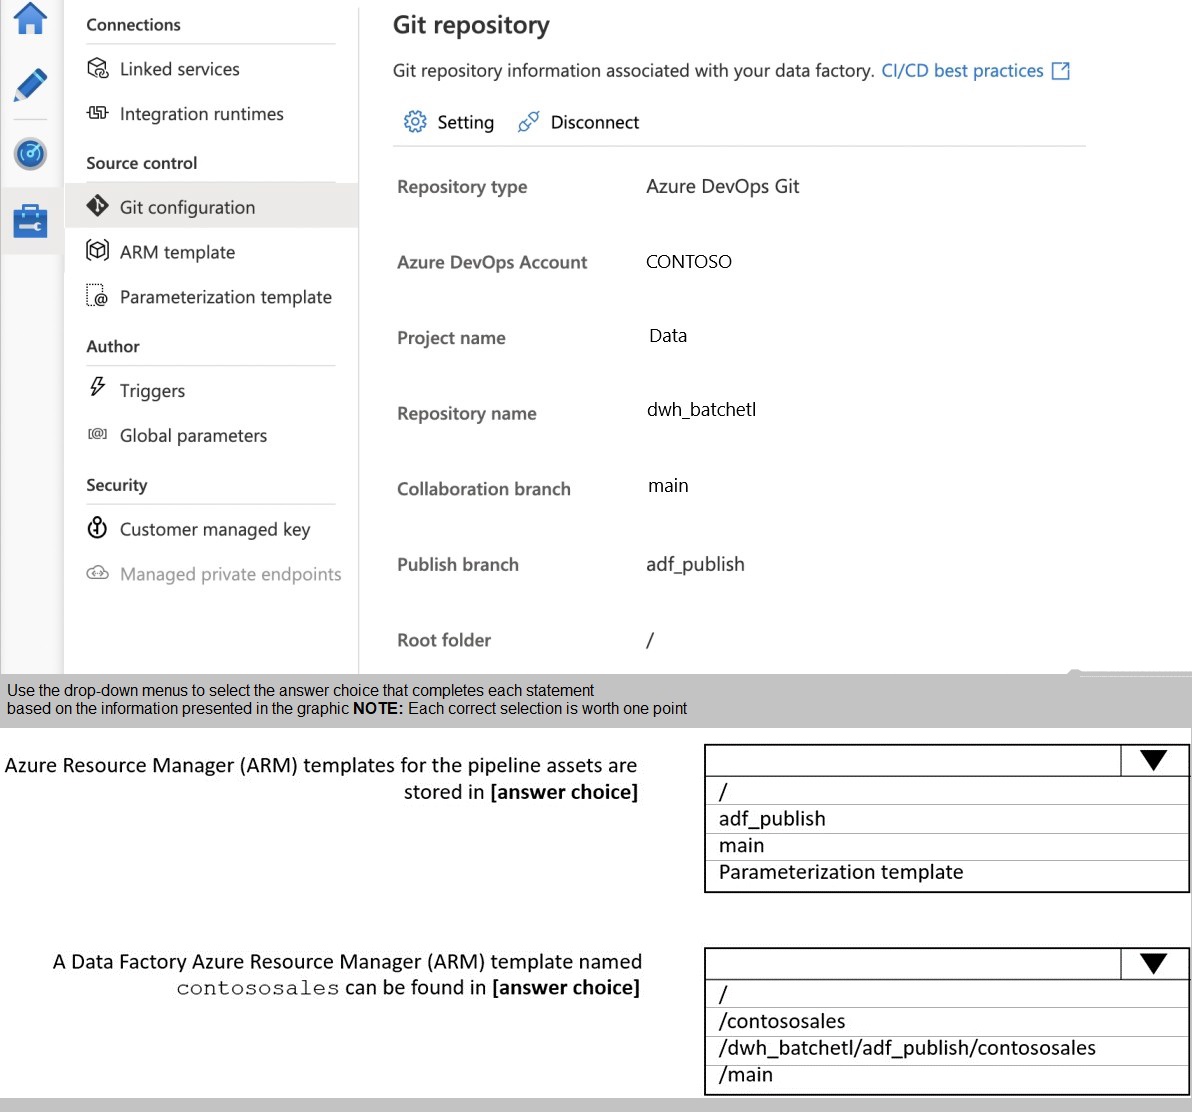
Explanation:
Azure Data Factory integrates with Git repositories for source control and CI/CD workflows. When configured with Azure DevOps Git, the collaboration branch (main) stores the actual Data Factory resources code, while the publish branch (adf_publish) stores Azure Resource Manager (ARM) templates generated from those resources. Understanding this distinction is crucial for CI/CD pipeline configuration.
Correct Option:
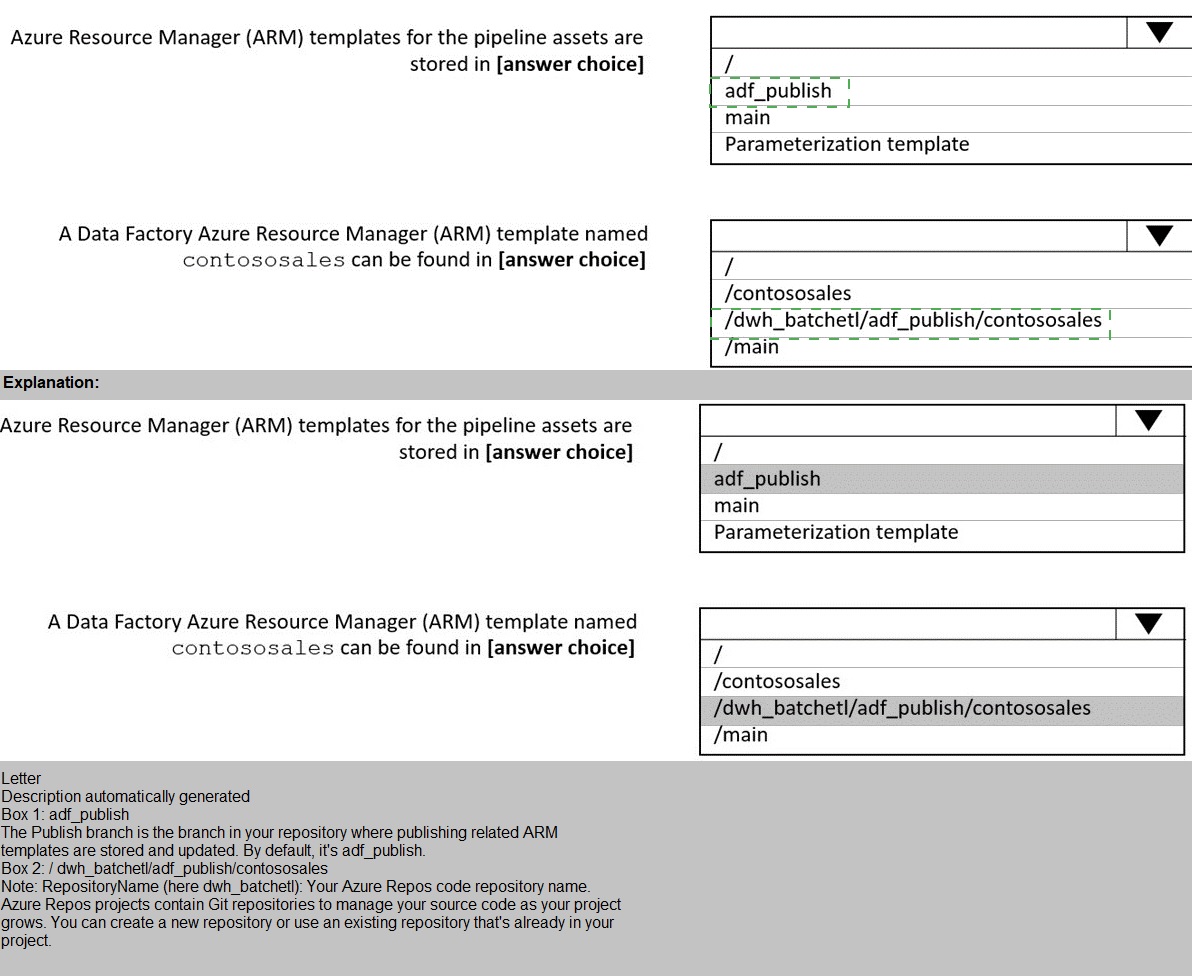
First dropdown: adf_publish
The publish branch (adf_publish) stores all ARM templates generated when publishing Data Factory resources. These templates are automatically created and updated in this branch during publish operations. The collaboration branch (main) contains the raw Data Factory resource code in JSON format, not compiled ARM templates.
Second dropdown: /dwh_batchelt/adf_publish/contososales
ARM templates are stored in the publish branch (adf_publish) with a specific naming convention. When you publish resources, Data Factory creates ARM templates in the format [factory_name]_[resource_type].json in the adf_publish branch. The path structure includes the repository name (dwh_batchelt) followed by the branch (adf_publish) and the template file name.
Incorrect Options:
First dropdown alternatives:
main: The main branch stores the actual Data Factory resource code in JSON format for source control and collaboration, not the compiled ARM templates.
Parameterization template: This is a template file for parameterizing ARM templates during deployment, not a storage location for ARM templates.
Second dropdown alternatives:
/contososales: This path does not exist in the repository structure shown in the exhibit. The repository name is dwh_batchelt, not contososales.
/main: ARM templates are not stored in the main branch. The main branch contains raw resource files, while compiled ARM templates are stored in adf_publish.
Reference:
Azure Data Factory CI/CD with Git Integration
Source Control and ARM Template Publishing in ADF
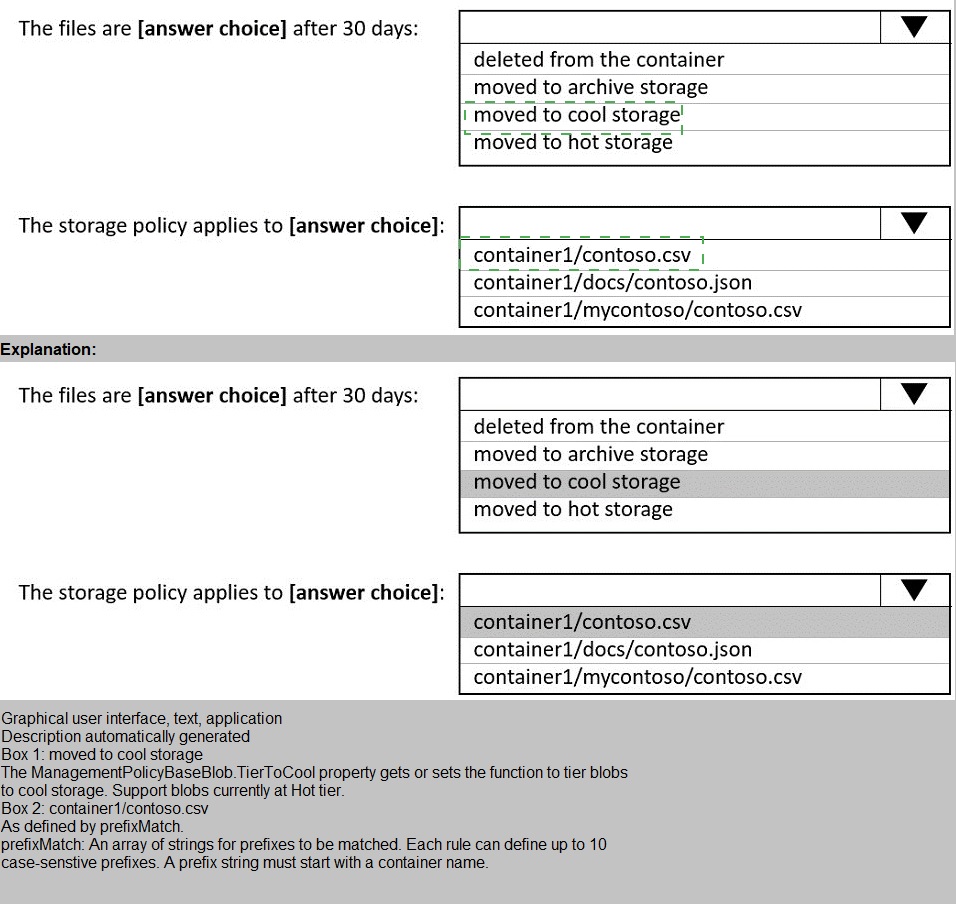
You store files in an Azure Data Lake Storage Gen2 container. The container has the storage policy shown in the following exhibit
Explanation:
Azure Storage lifecycle management policies automate tiering and deletion of blobs based on conditions. The policy definition includes actions (tiering or deletion) and filters (blob types and prefixes). Understanding how filters apply to paths and which actions trigger at different thresholds is essential for proper policy configuration.
Correct Option:
First dropdown: moved to cool storage
The policy definition shows an action for "baseBlob" with "tierToCool" when "daysAfterModificationGreaterThan": 30. This means blobs matching the filters will be moved to cool storage tier 30 days after their last modification date. The policy does not specify deletion or other tiering actions.
Second dropdown: container1/contoso.csv
The prefix filter is set to "container1/contoso". This matches blobs where the path starts with this exact string. container1/contoso.csv starts with "container1/contoso" and qualifies. The other options have additional path segments or different structures that don't match this prefix.
Incorrect Options:
First dropdown alternatives:
deleted from the container: No delete action is configured for base blobs. The delete action applies to versions with "daysAfterCreationGreaterThan": 60, not to base blobs after 30 days.
moved to archive storage: The policy moves blobs to cool tier, not archive. Archive would require a different tiering action.
moved to hot storage: Hot tier is the default and cannot be targeted by lifecycle policies as a destination from other tiers.
Second dropdown alternatives:
container1/docs/contoso.json: This path starts with "container1/docs", not "container1/contoso", so it doesn't match the prefix filter. The filter requires the exact prefix string.
container1/mycontoso/contoso.csv: While this contains "contoso" in the path, it starts with "container1/mycontoso", not "container1/contoso". Prefix filters match from the beginning of the path.
Reference:
Azure Storage Lifecycle Management Policies
Configure Lifecycle Management for Azure Storage Blobs
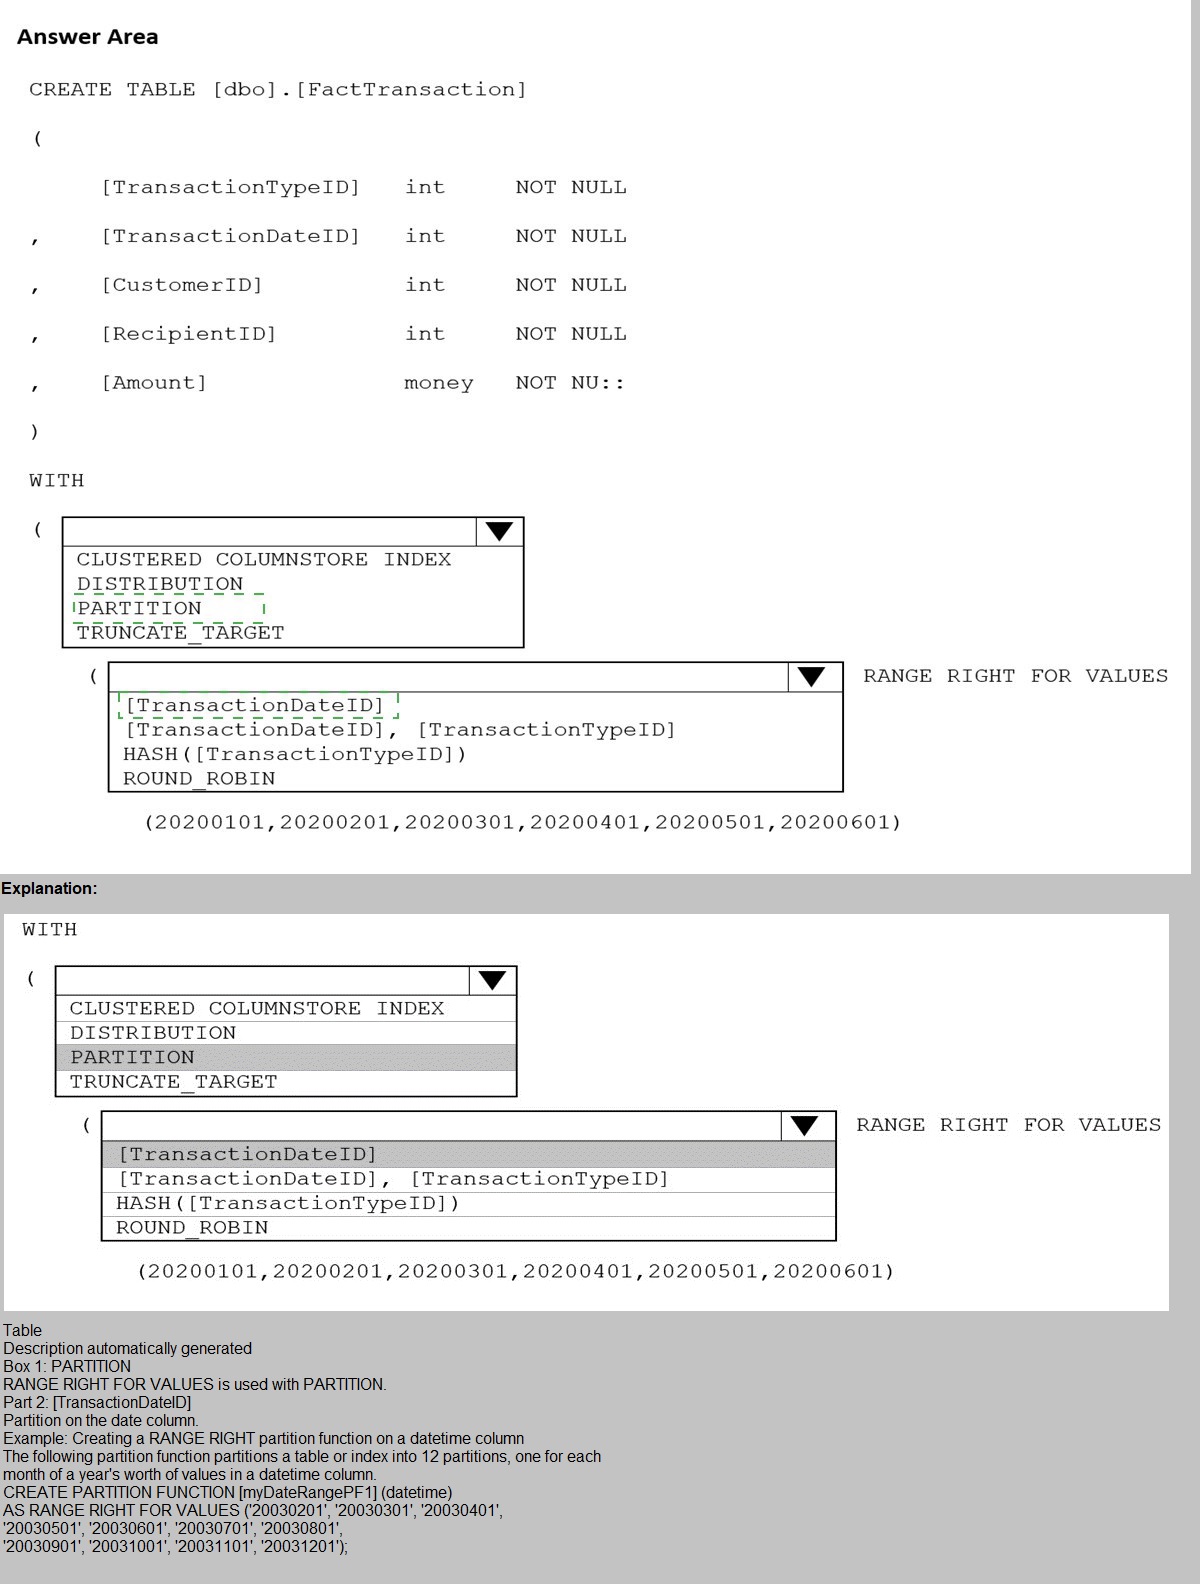
You are building an Azure Synapse Analytics dedicated SQL pool that will contain a fact table for transactions from the first half of the year 2020.
You need to ensure that the table meets the following requirements:
Minimizes the processing time to delete data that is older than 10 years Minimizes the I/O for queries that use year-to-date values
How should you complete the Transact-SQL statement? To answer, select the appropriate options in the answer area.
NOTE: Each correct selection is worth one point.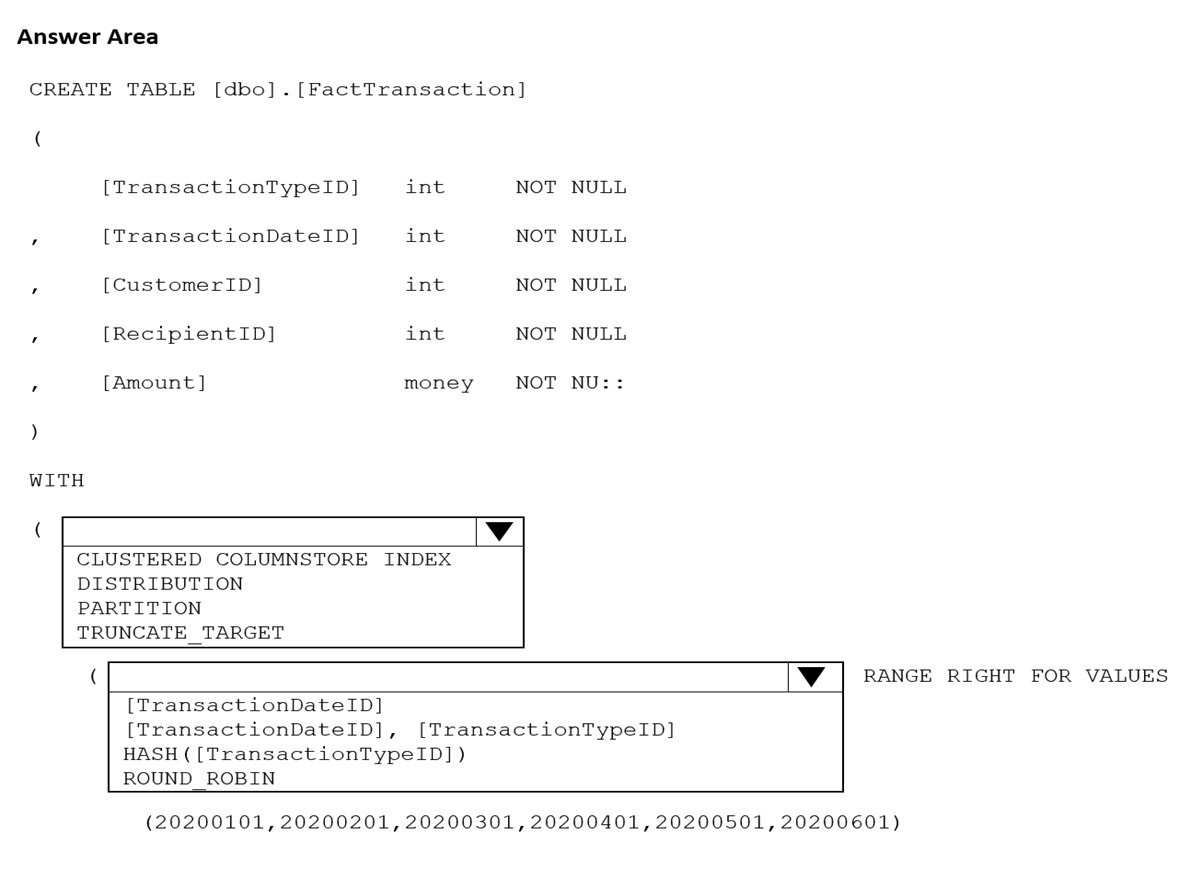
Explanation:
Azure Synapse dedicated SQL pools require careful design of distribution and partitioning to optimize performance for specific workload patterns. The requirements focus on efficient deletion of old data and minimizing I/O for year-to-date queries. Partitioning enables fast partition switching for deletion, while distribution affects query performance.
Correct Option:
First dropdown: PARTITION
The requirement to minimize processing time for deleting data older than 10 years points to partitioning. Partition switching allows instant removal of entire partitions without traditional DELETE operations. This makes partition management the key feature for efficient aged data removal.
Second dropdown: [TransactionDateID] RANGE RIGHT FOR VALUES
Partitioning on TransactionDateID enables year-to-date query optimization through partition elimination. Queries filtering on date ranges will only scan relevant partitions. RANGE RIGHT defines partition boundaries appropriately for date-based partitioning.
Incorrect Options:
First dropdown alternatives:
CLUSTERED COLUMNSTORE INDEX: This is already specified and defines storage format, not the distribution/partitioning method.
DISTRIBUTION: Distribution determines how data spreads across nodes but doesn't directly enable fast deletion operations.
TRUNCATE_TARGET: This is a table property for copy operations, not a partitioning or distribution method.
Second dropdown alternatives:
[TransactionDateID], [TransactionTypeID]: Multi-column partitioning is not recommended in Synapse and wouldn't optimize for date-based queries.
HASH([TransactionTypeID]): This is a distribution method, not a partition specification.
ROUND_ROBIN: This is a distribution method that distributes data evenly without optimization for specific query patterns.
Reference:
Table Partitioning in Azure Synapse Dedicated SQL Pool
Distribution Strategies in Synapse SQL Pool
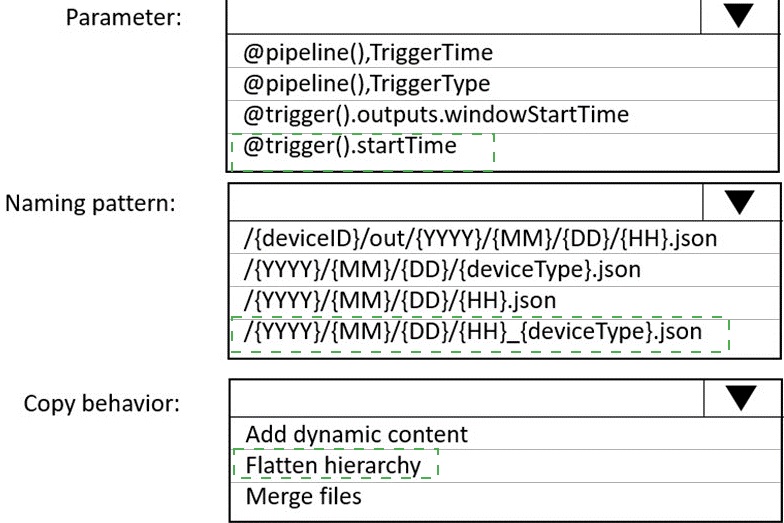
You are building an Azure Data Factory solution to process data received from Azure Event Hubs, and then ingested into an Azure Data Lake Storage Gen2 container.The data will be ingested every five minutes from devices into JSON files. The files have the following naming pattern.
/{deviceType}/in/{YYYY}/{MM}/{DD}/{HH}/{deviceID}_{YYYY}{MM}{DD}HH}{mm}.json
You need to prepare the data for batch data processing so that there is one dataset per hour per deviceType. The solution must minimize read times.
How should you configure the sink for the copy activity? To answer, select the appropriate options in the answer area.
NOTE: Each correct selection is worth one point.
Explanation:
Azure Data Factory copy activities can transform data during ingestion through sink configuration. When preparing data for batch processing with specific grouping requirements, the sink settings determine how files are organized and structured. The goal is to reorganize incoming files into an optimized folder structure for efficient batch reads.
Correct Option:
First dropdown: /{deviceType}/out/{YYYY}/{MM}/{DD}/{HH}.json
This naming pattern creates one file per hour per deviceType by grouping all files from the same hour into a single output file. The structure places deviceType at the root level for easy filtering, with year/month/day/hour hierarchy that enables partition elimination in batch processing engines like Synapse or Databricks.
Second dropdown: Merge files
Merge files copy behavior combines multiple input files into single output files based on the naming pattern. Since multiple device files arrive every five minutes within each hour, merging them creates one consolidated file per hour per deviceType, minimizing the number of files that batch processing jobs need to read.
Incorrect Options:
First dropdown alternatives:
/{deviceID}/out/{YYYY}/{MM}/{DD}/{HH}.json: This would create separate files per device, not meeting the requirement of one dataset per hour per deviceType.
/{YYYY}/{MM}/{DD}/{deviceType}.json: Missing hour granularity, would combine all hours of a day into one file, increasing read times for hourly batch processing.
/{YYYY}/{MM}/{DD}/{HH}_{deviceType}.json: This could work but places deviceType at the end, making partition elimination less efficient in some query engines.
Second dropdown alternatives:
Add dynamic content: This refers to expression-based column mapping, not file consolidation behavior.
Flatten hierarchy: This option relates to nested JSON structure processing, not file merging or organization.
Reference:
Azure Data Factory Copy Activity Sink Configuration
File Merging in Data Factory Copy Activity
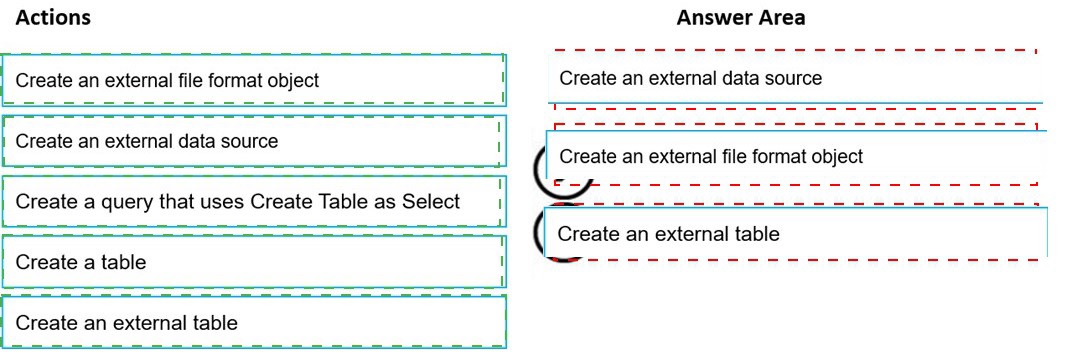
You need to build a solution to ensure that users can query specific files in an Azure Data Lake Storage Gen2 account from an Azure Synapse Analytics server less SQL pool. Which three actions should you perform in sequence? To answer, move the appropriate actions from the list of actions to the answer area and arrange them in the correct order. NOTE: More than one order of answer choices is correct. You will receive credit for any of the correct orders you select.
Explanation:
Azure Synapse serverless SQL pool queries data directly from Azure Data Lake Storage using external tables. Setting up external tables requires specific objects to be created in the correct sequence. Each object builds upon previous ones to establish the connection between the SQL pool and the storage location with proper formatting.
Correct Sequence:
First action: Create an external data source
The external data source defines the storage location (ADLS Gen2 account and container) that will be queried. This must be created first as it provides the foundation for accessing files.
Second action: Create an external file format object
The external file format specifies how files are structured (CSV, Parquet, etc.) including options like field terminators, compression, and encoding. This defines the parsing rules for the files.
Third action: Create an external table
The external table combines the data source and file format with a specific file path and schema definition. This creates a queryable table object that users can access with standard T-SQL queries.
Incorrect Actions:
Create a query that uses Create Table as Select: This is for creating tables from query results, not for setting up external data access.
Create a table: This refers to regular tables in the database, not external tables that reference storage locations.
Reference:
Query Azure Data Lake Storage with Serverless SQL Pool
Creating External Tables in Synapse Serverless SQL
| Page 2 out of 21 Pages |